
Quiz
Which of the following is a feature of this pathology?
- Caudate lobe atrophy
- Right lobe hypertrophy
- Caudate lobe hypertrophy
Key Imaging Features:
Ultrasound:
B mode:
- Surface nodularity.
- Coarse echotexture- pinhead echoes, inhomogenous in distribution, with no posterior shadows.
- Regenerative nodules.
- Caudate lobe hypertrophy (caudate / right lobe ratio > 0.65).
- Poor visualization of hepatic vessels.
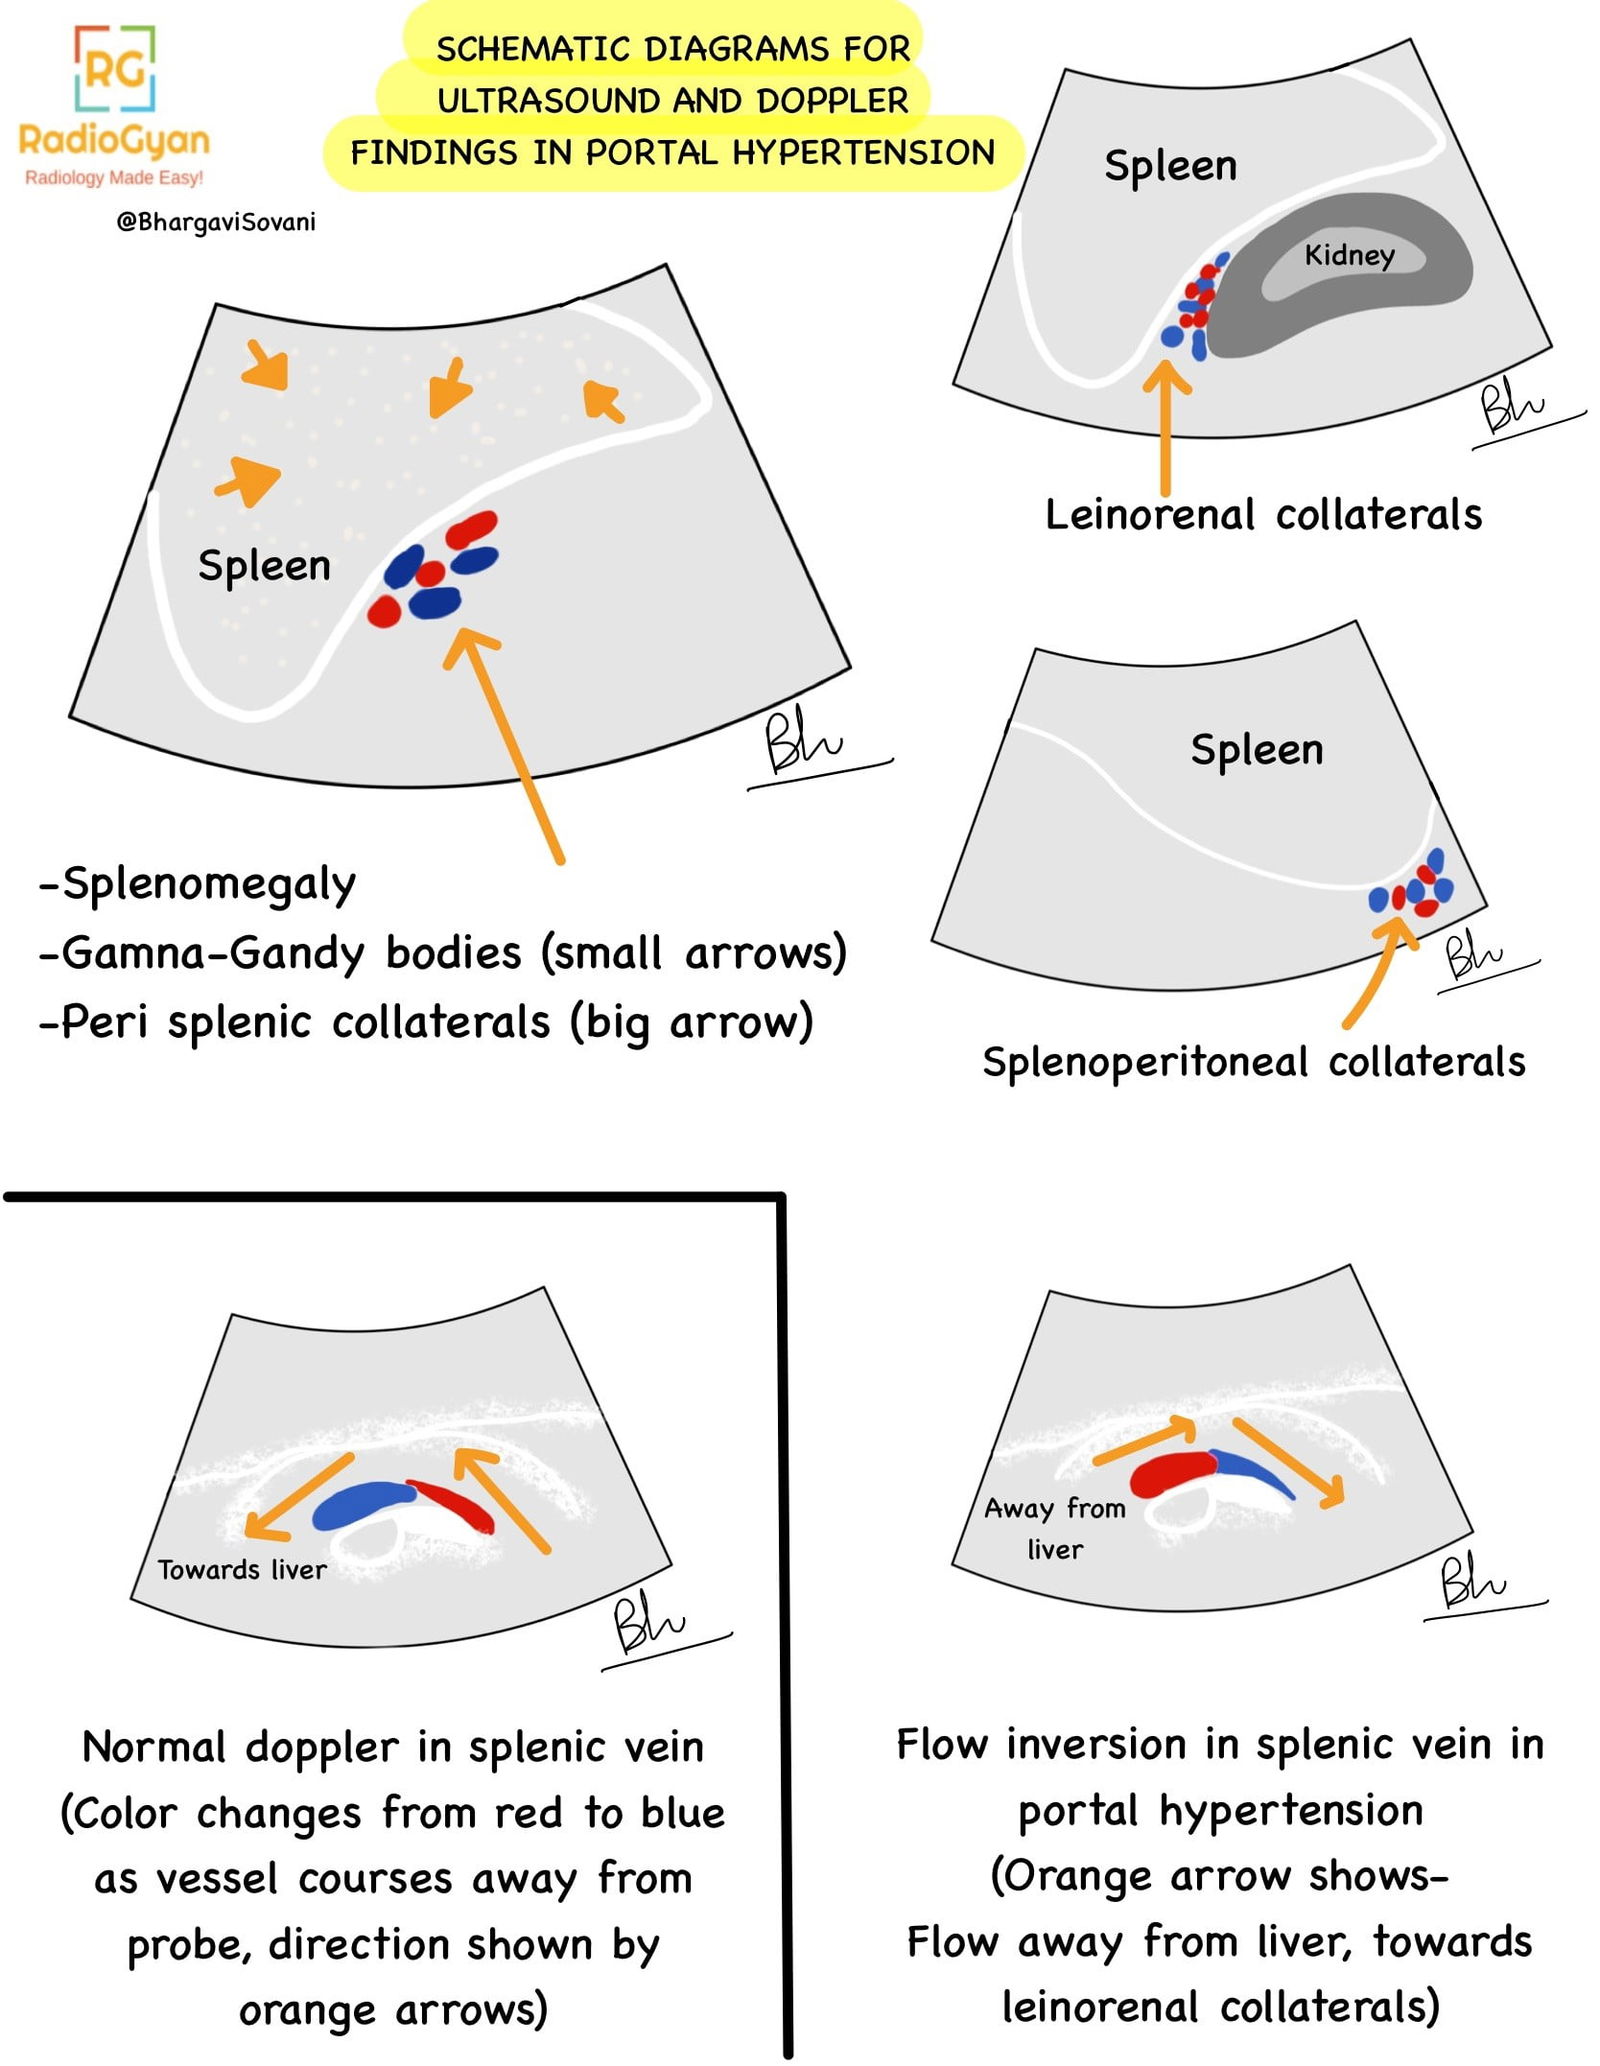
- Splenomegaly (mid axillary length >13cm or largest cross sectional area through the hilum > 45 square cm).
- Gamna Gandy nodules: Multiple hyperechogenic nodules due to microbleed foci in the spleen and siderotic changes.
- Splenic interface sign: Linear hyperreflective channels in splenic parenchyma due to dilated intrasplenic venous sinuses with deposition of collagen in the walls.
- Increase in bowel wall and gallbladder wall thickness due to edema.
Color Doppler:
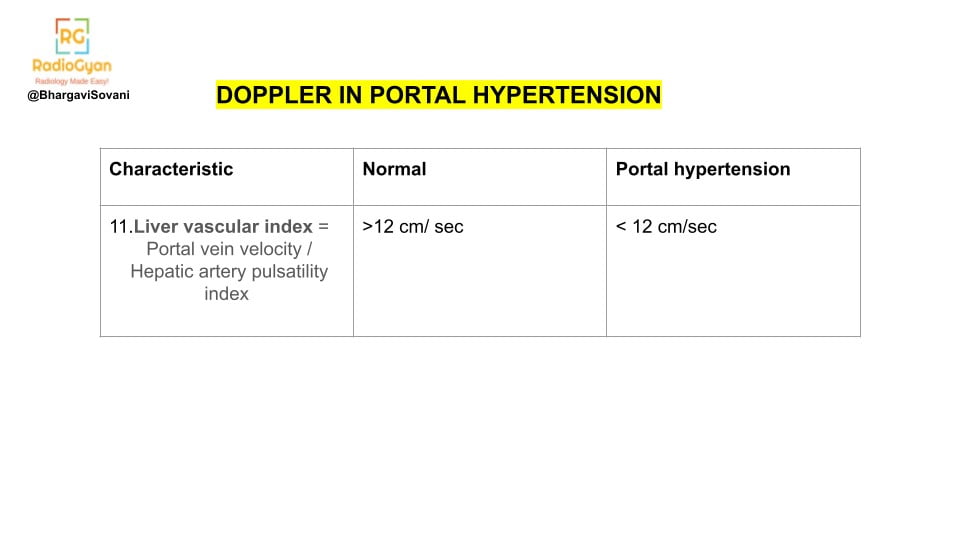
Alteration in normal doppler findings and spectral traces of portal vein, hepatic artery and hepatic vein.
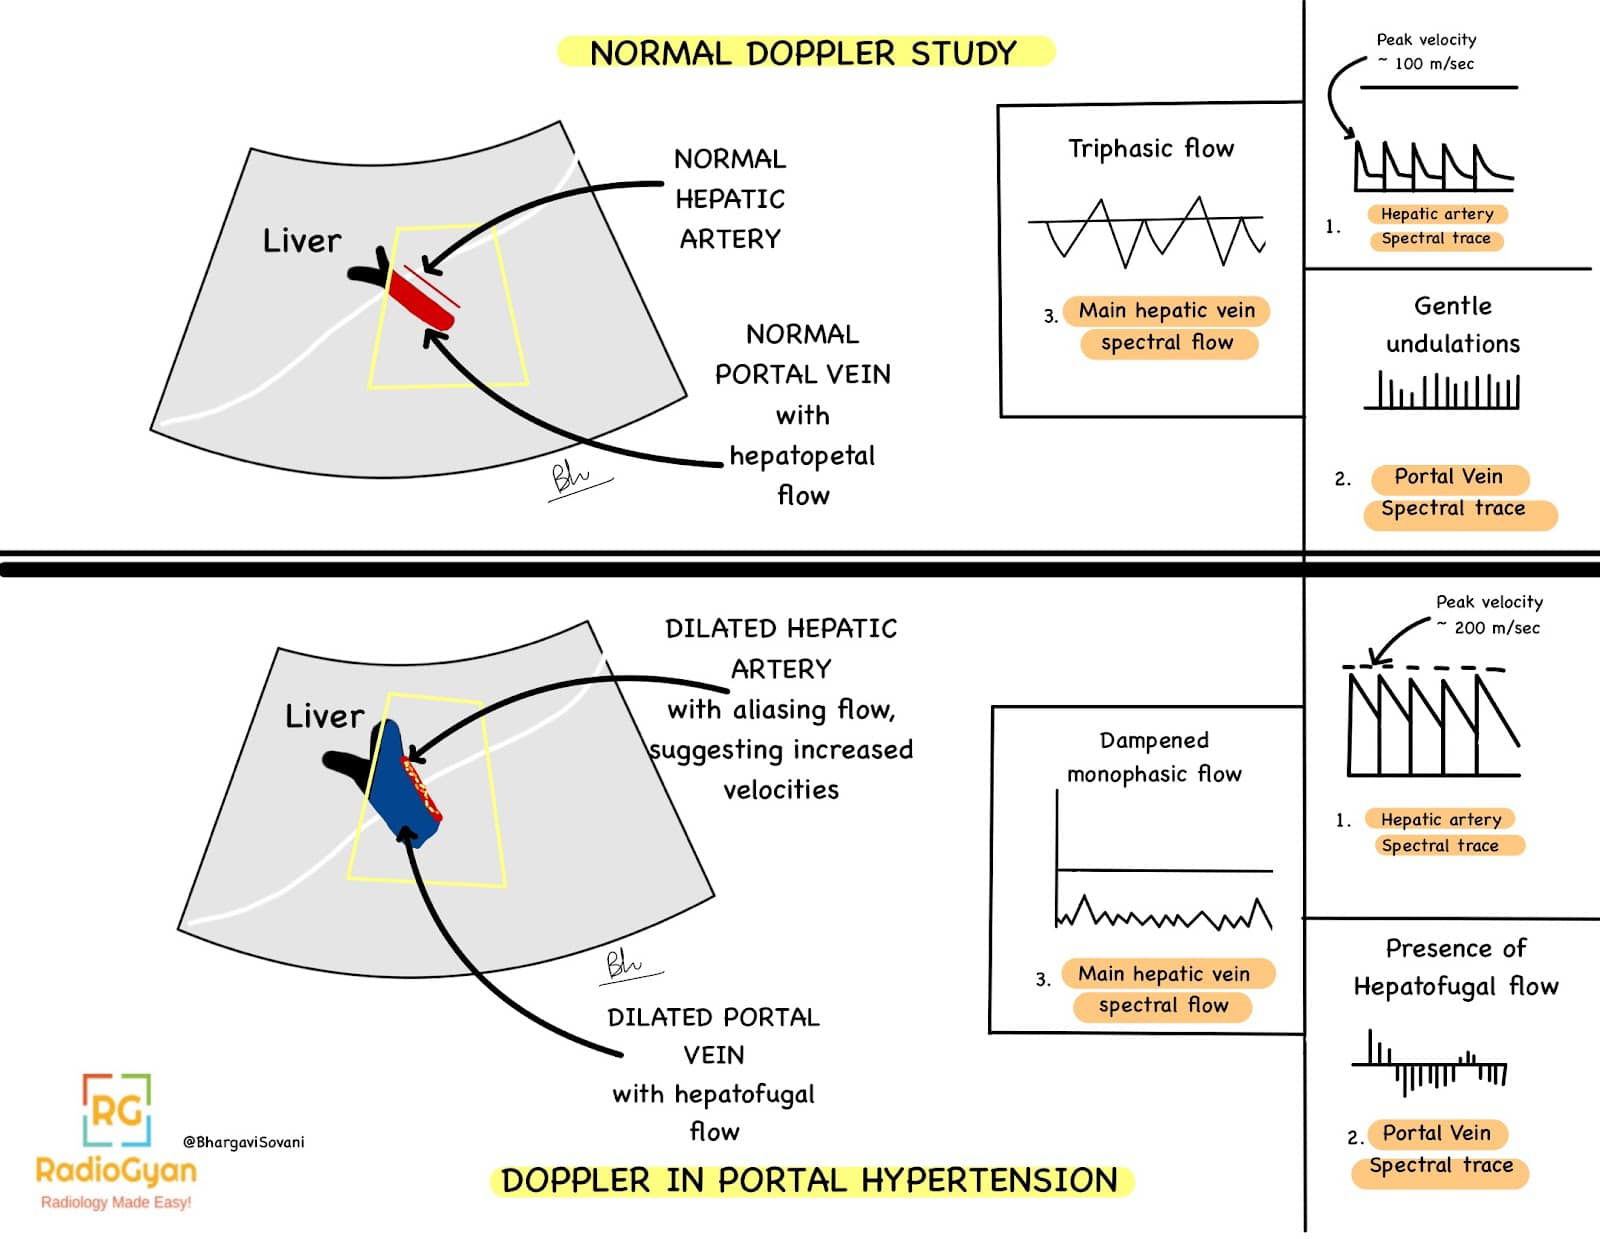
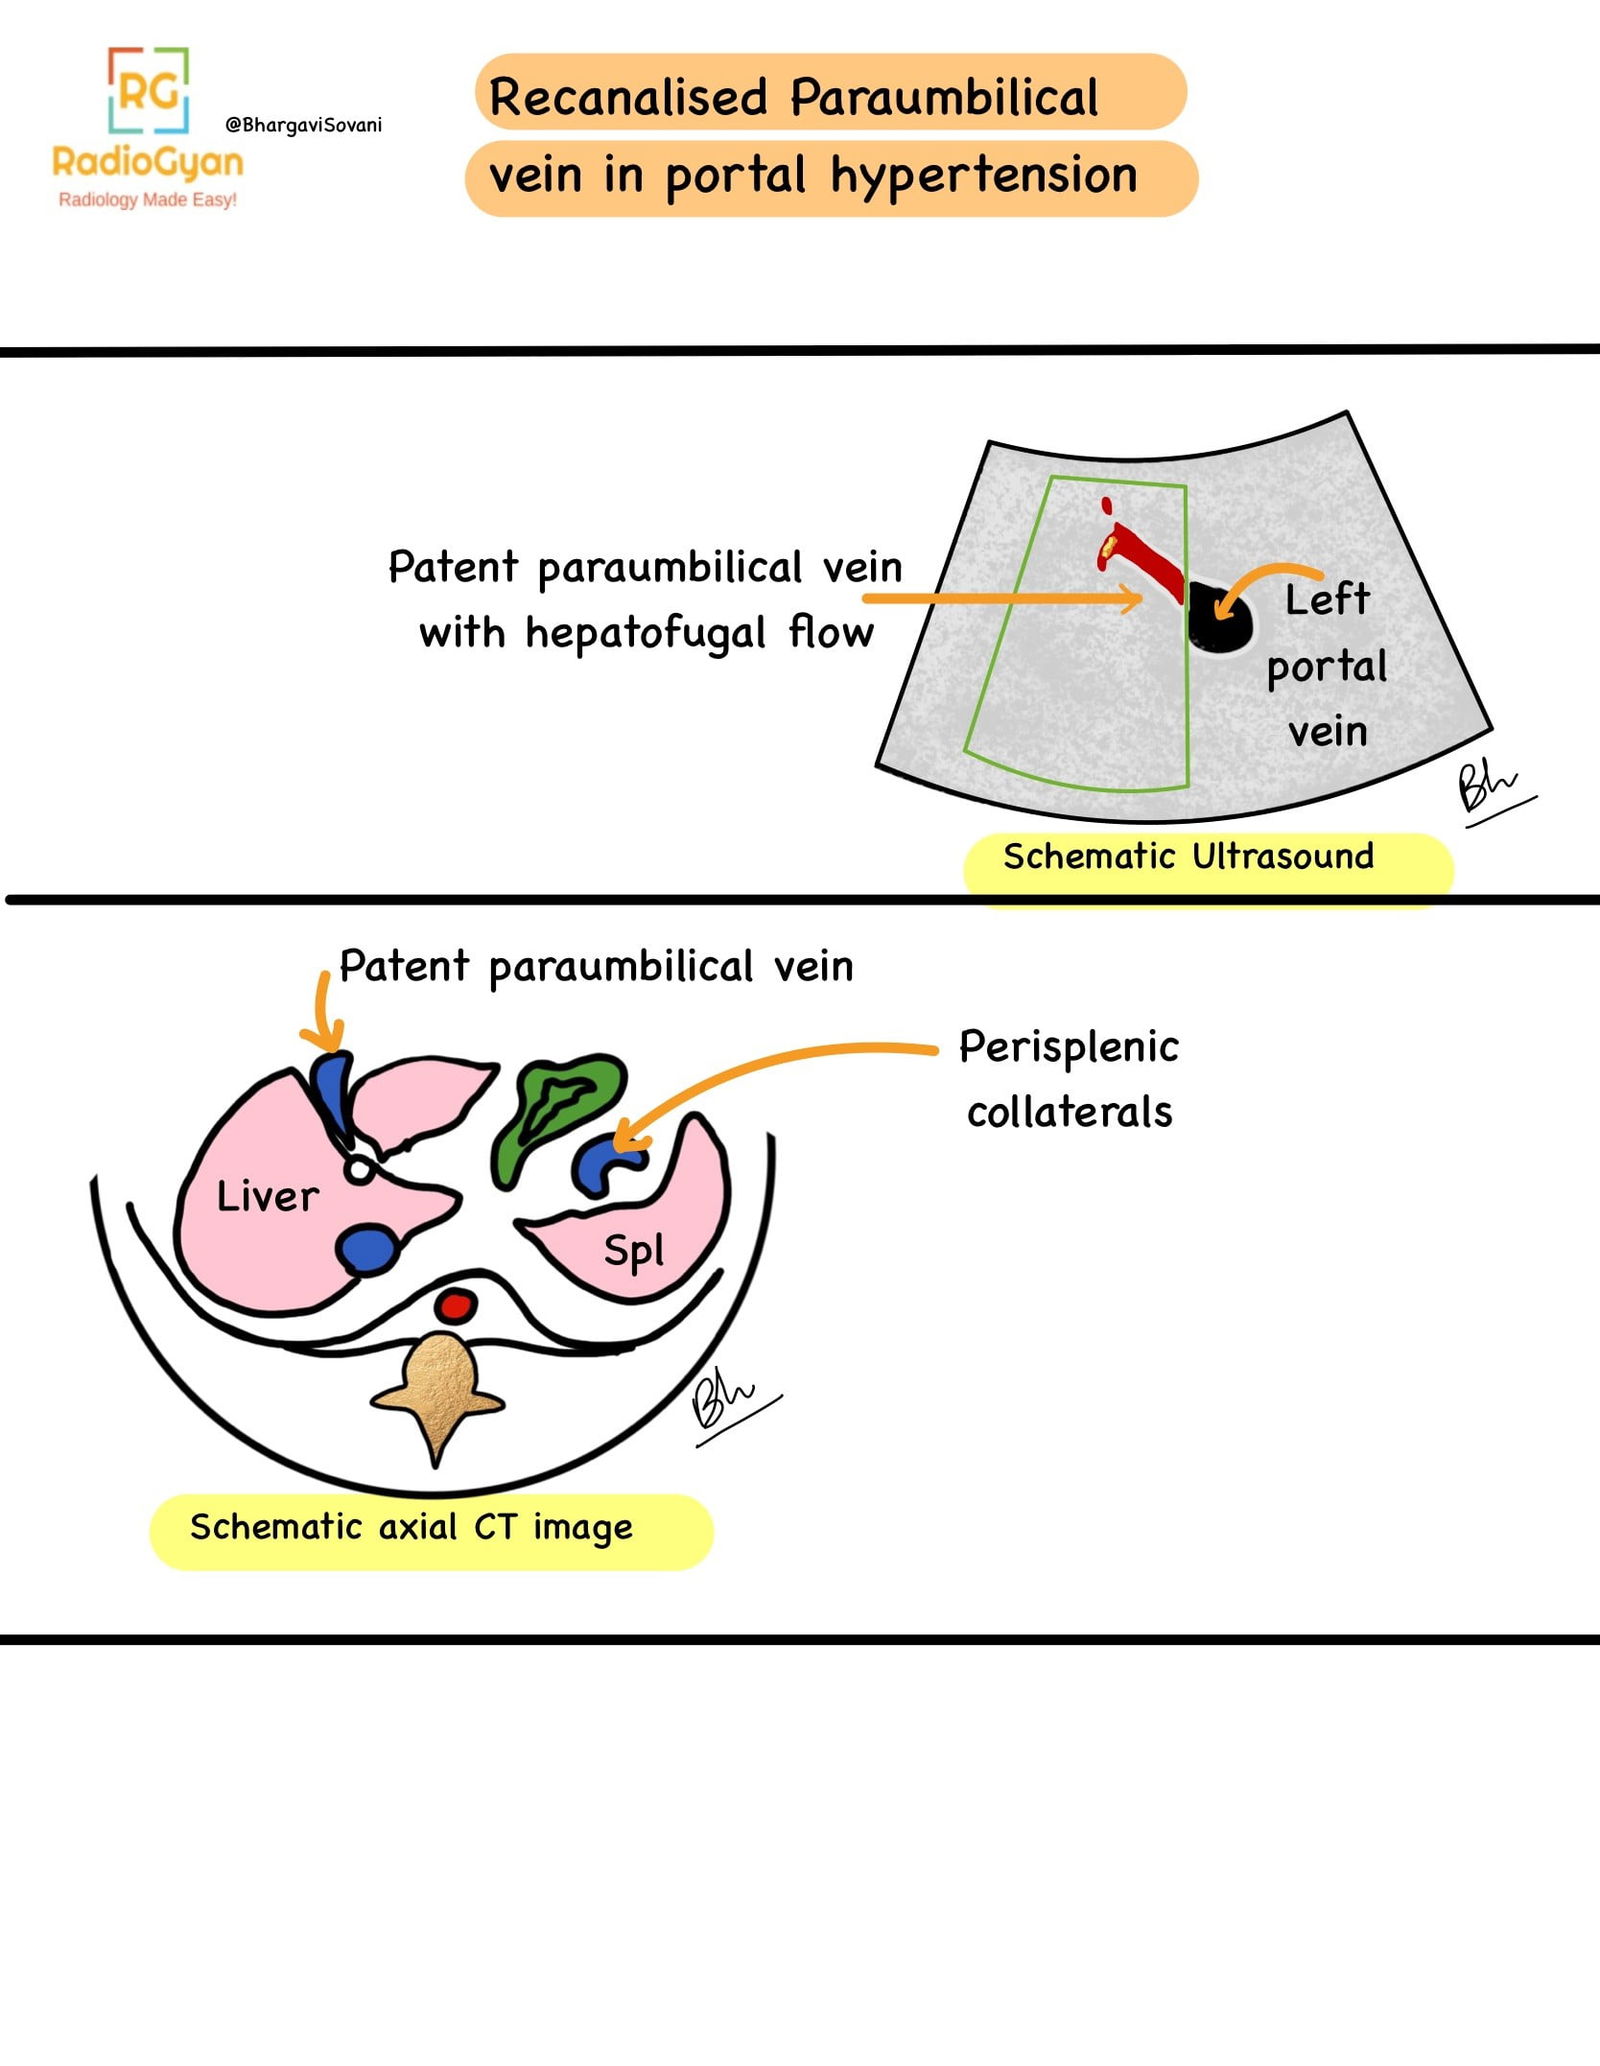
- Visualization of collaterals and varices on color doppler. Following are a few schematic diagrams describing ultrasound and doppler features.
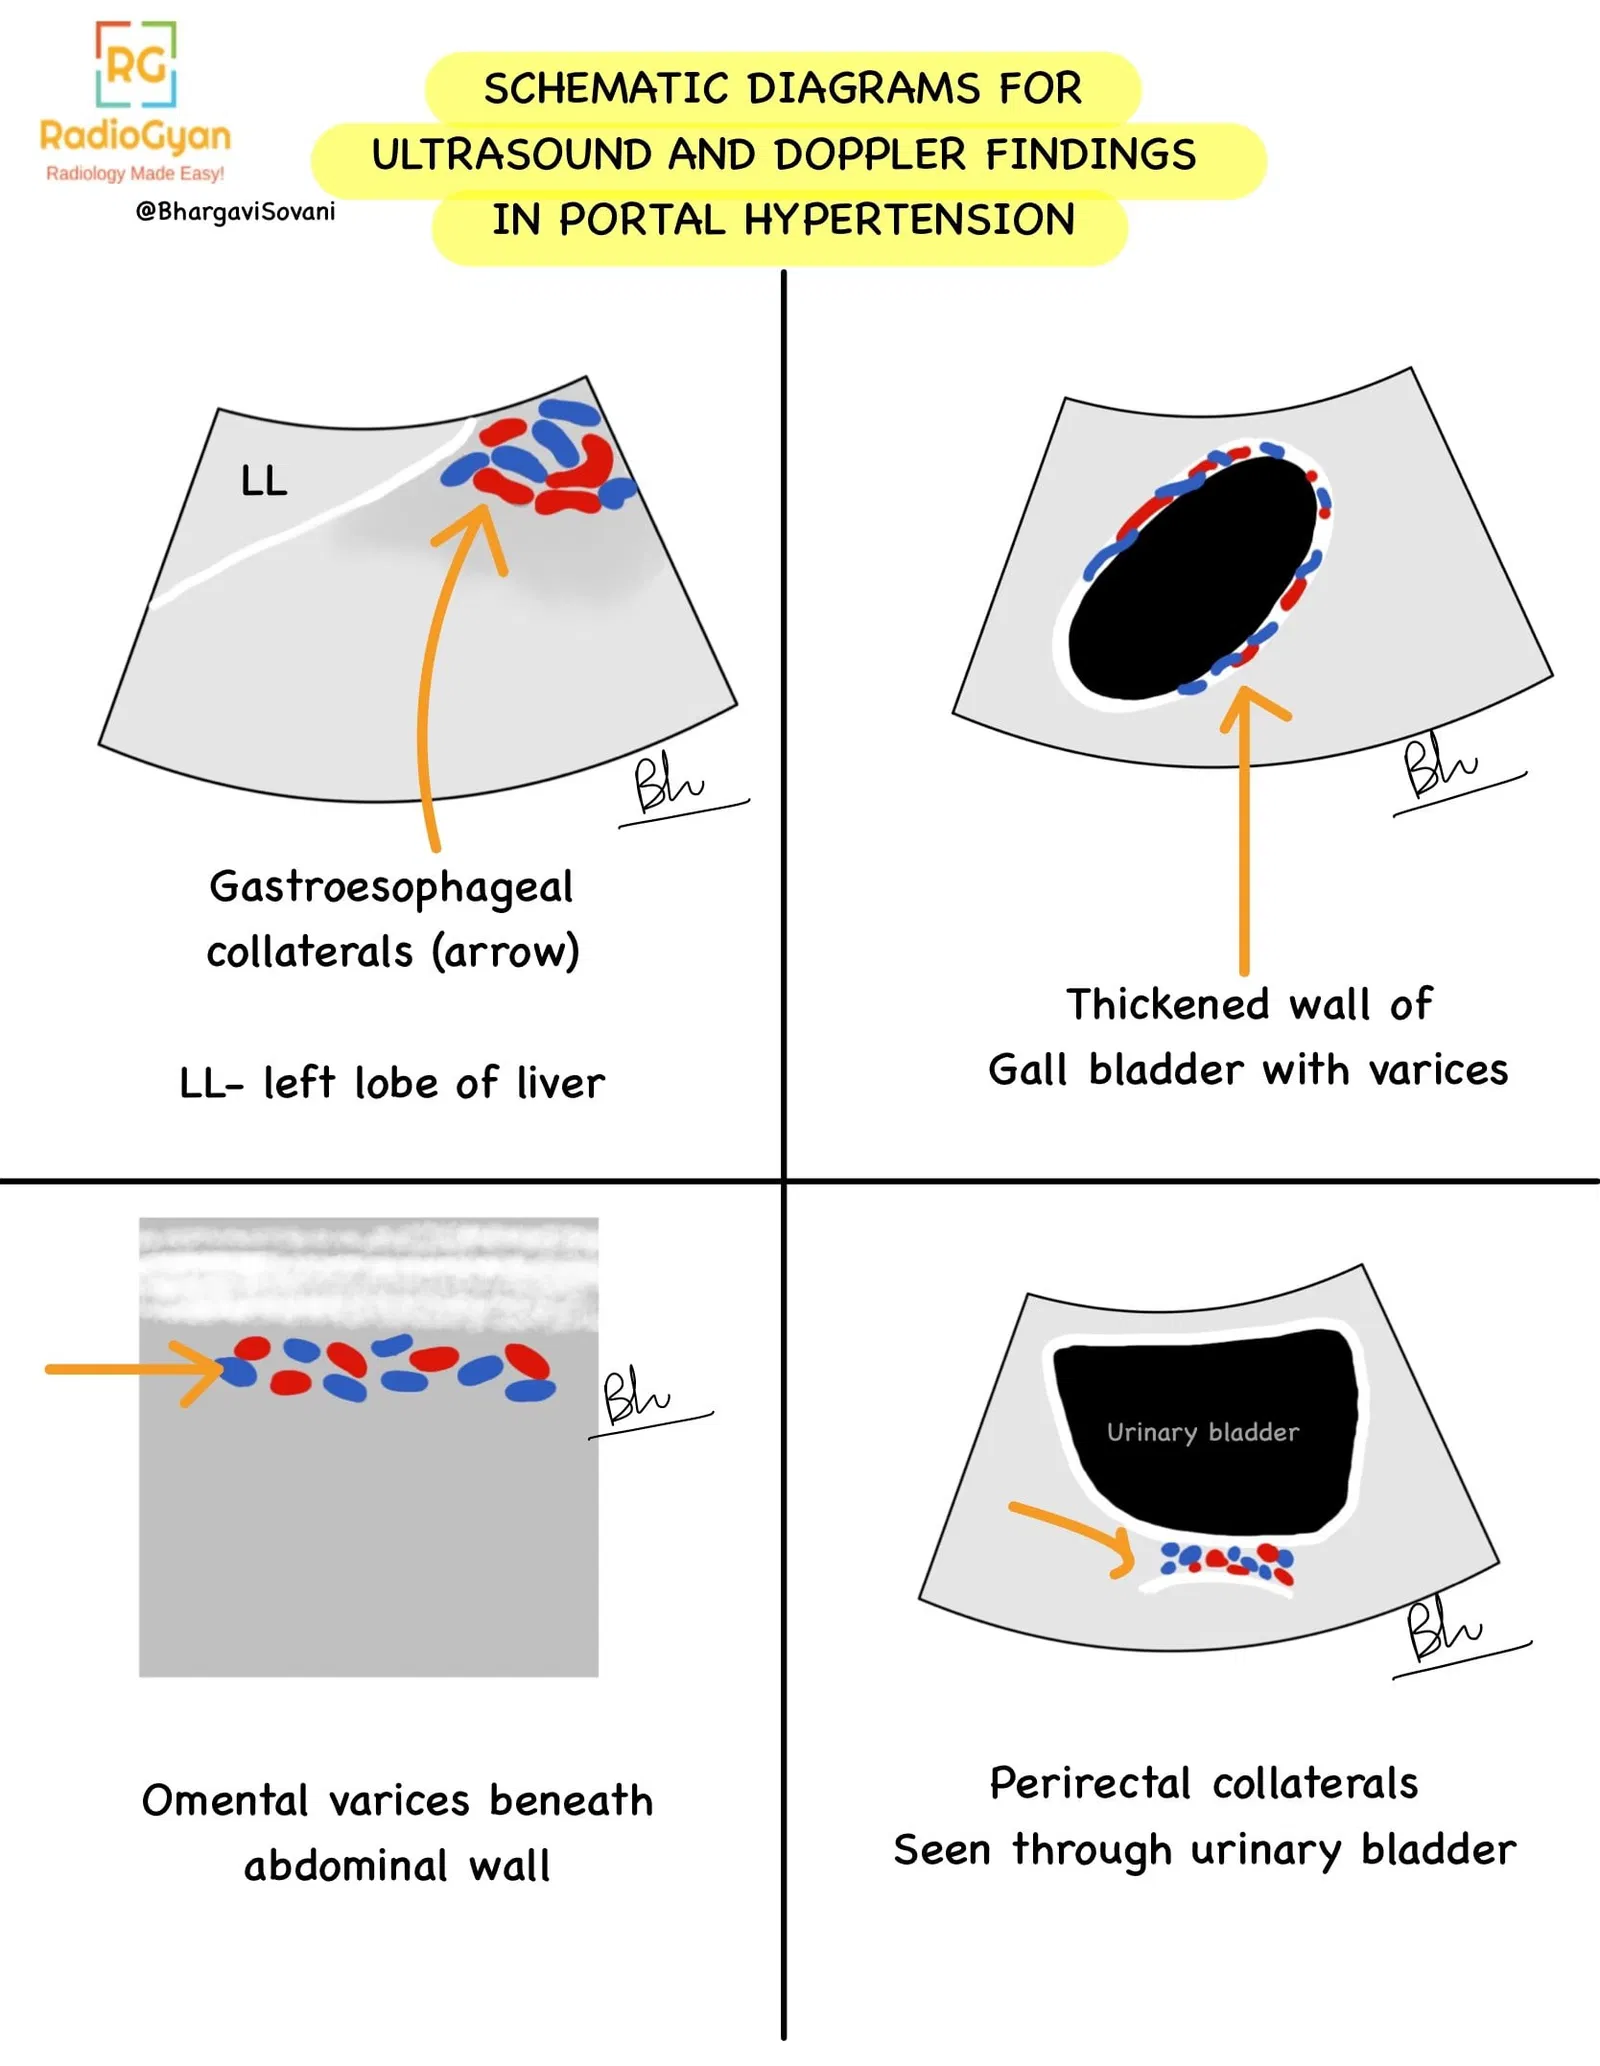
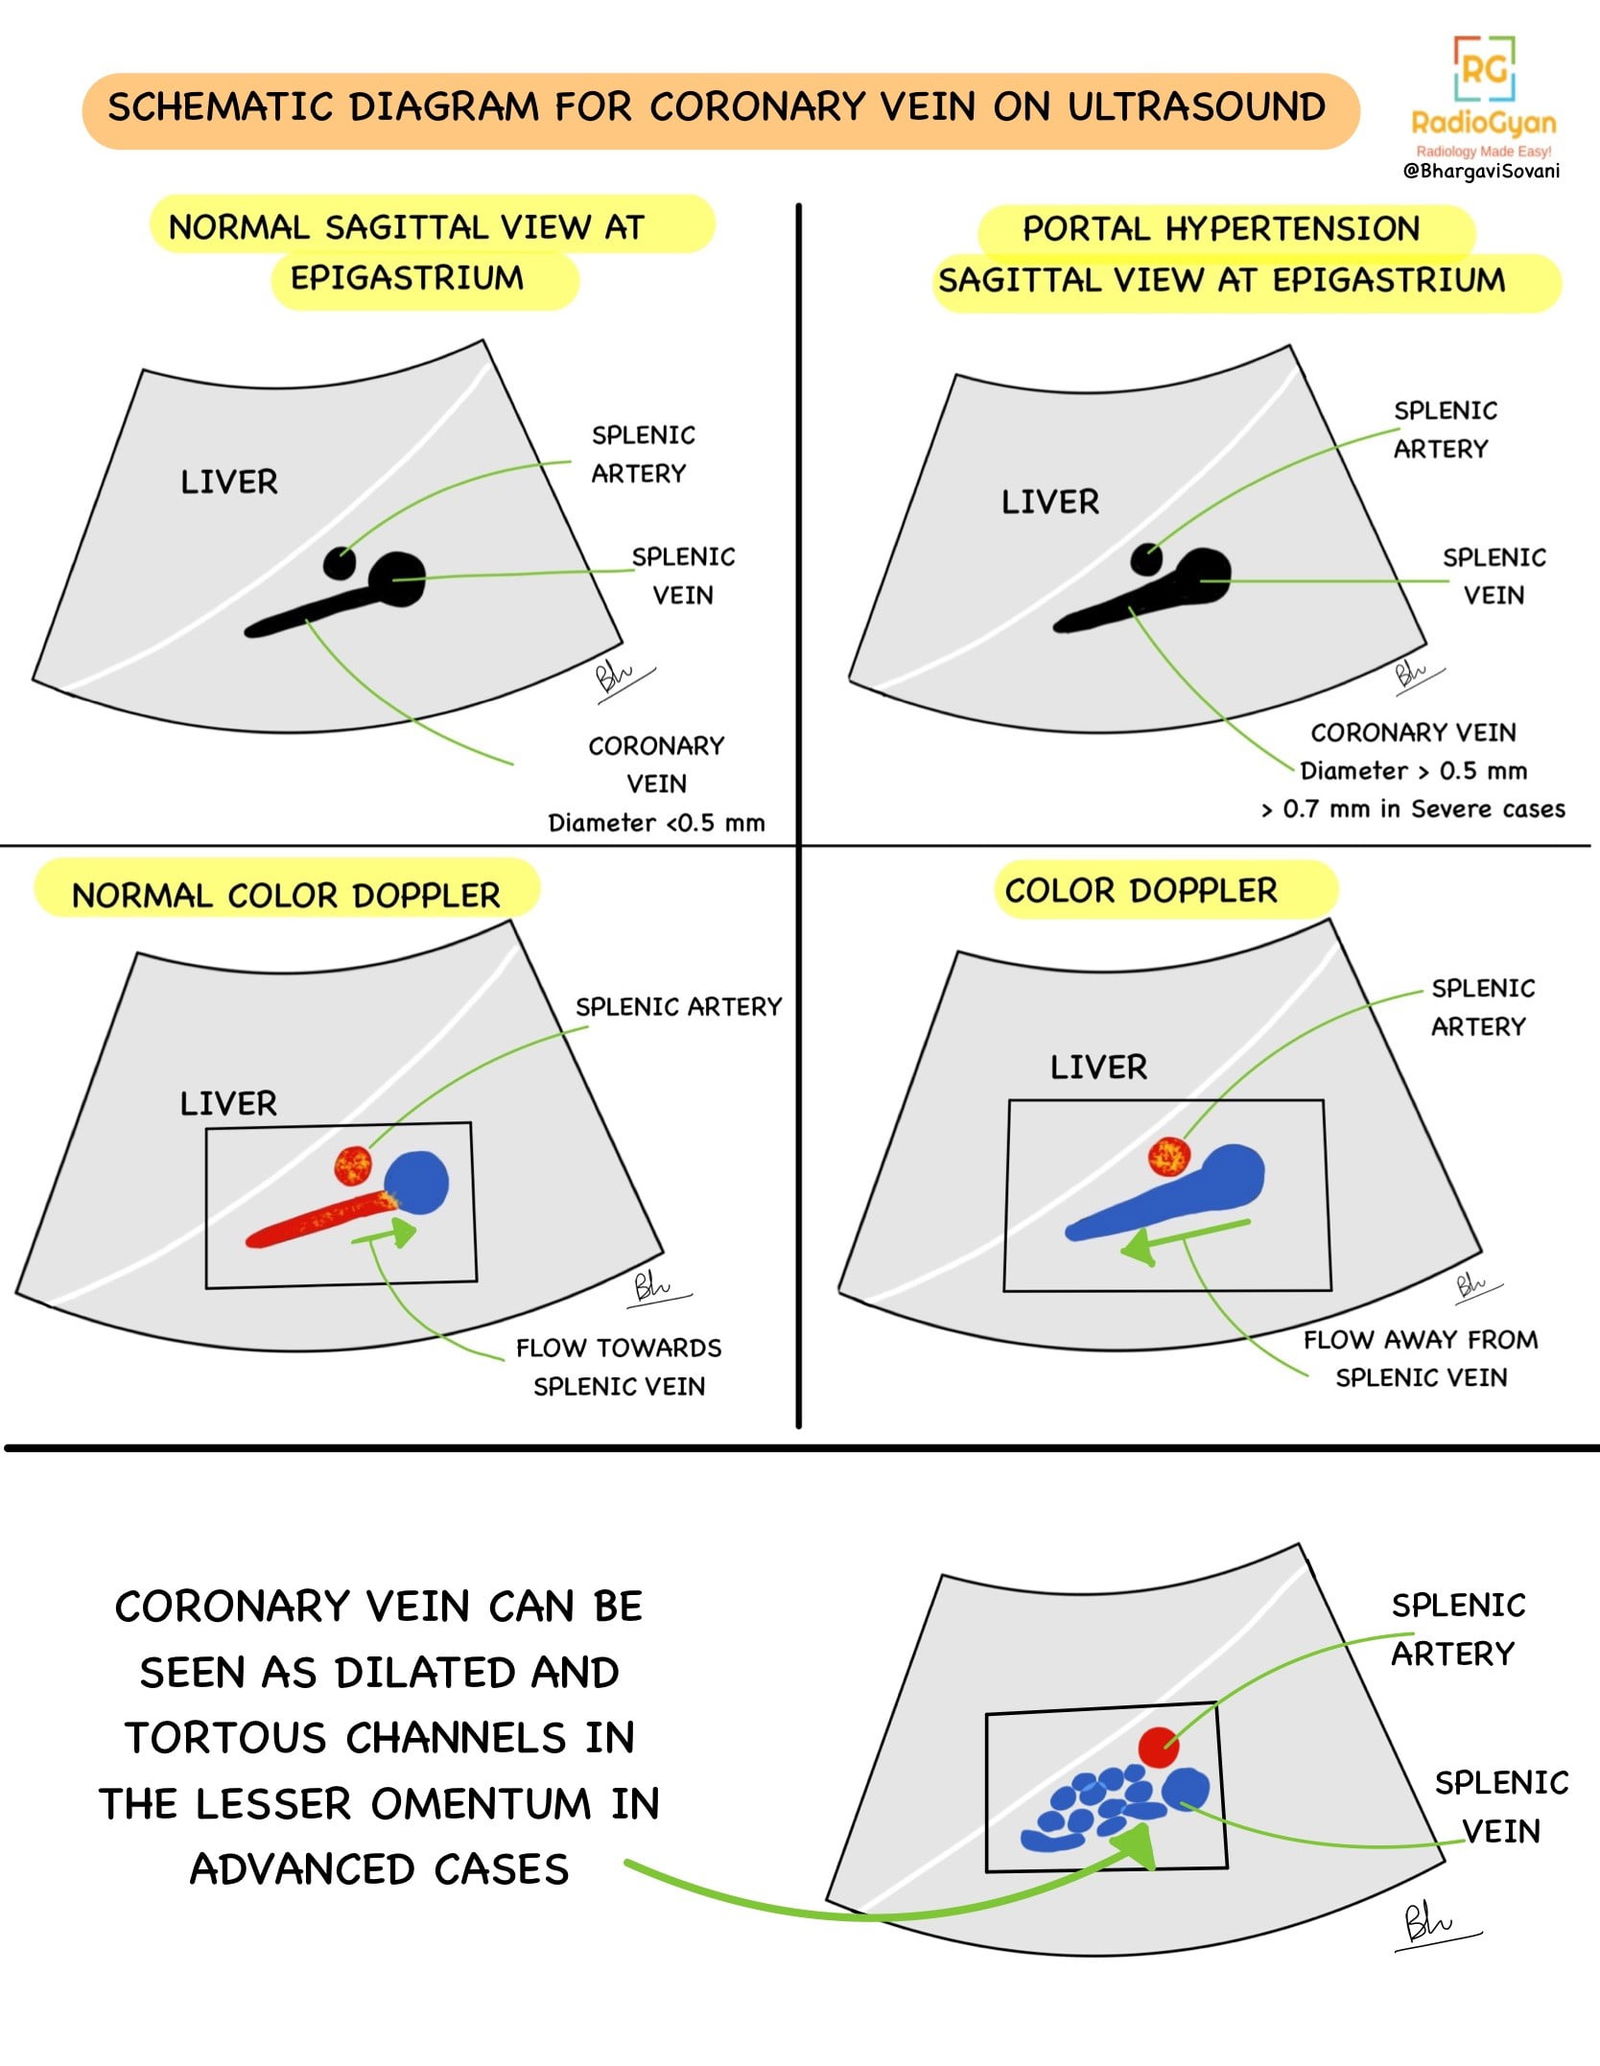
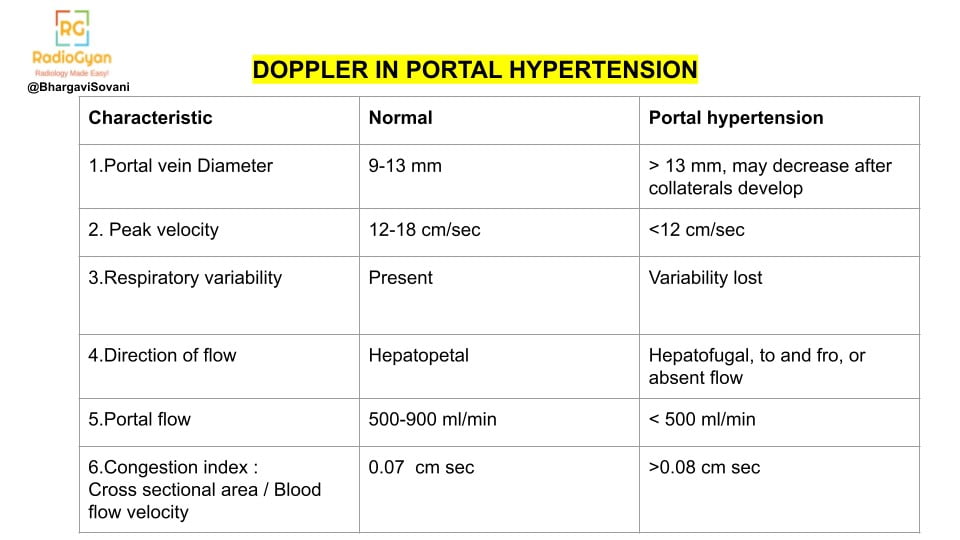
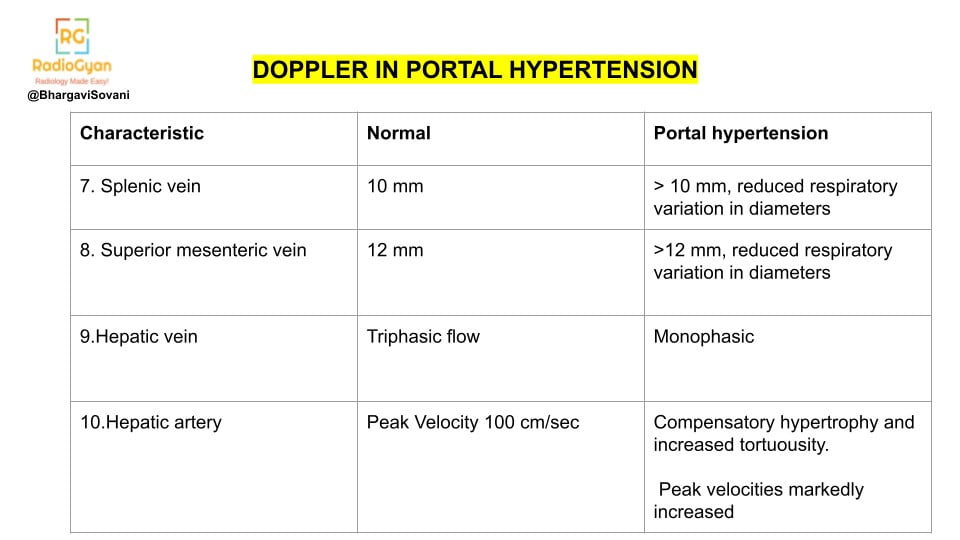
- Summarized list of features on doppler is as follows:
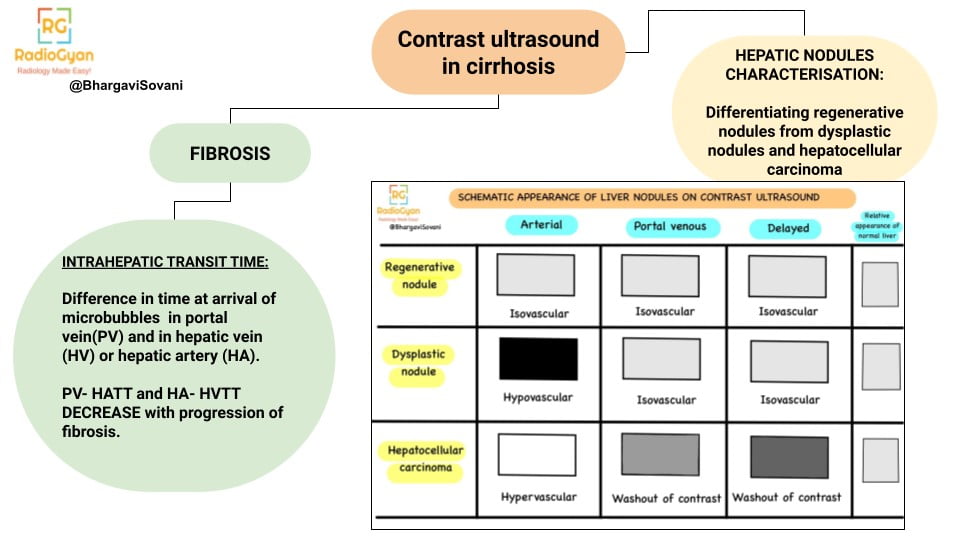
Contrast enhanced ultrasound:
- Role of contrast enhanced ultrasound is described in the following chart.
Elastography:
- TE and acoustic radiation force impulse (ARFI) are most commonly used.
- > 7 kPa: Advanced fibrosis
>12.5 – 15 kPa: Cirrhosis
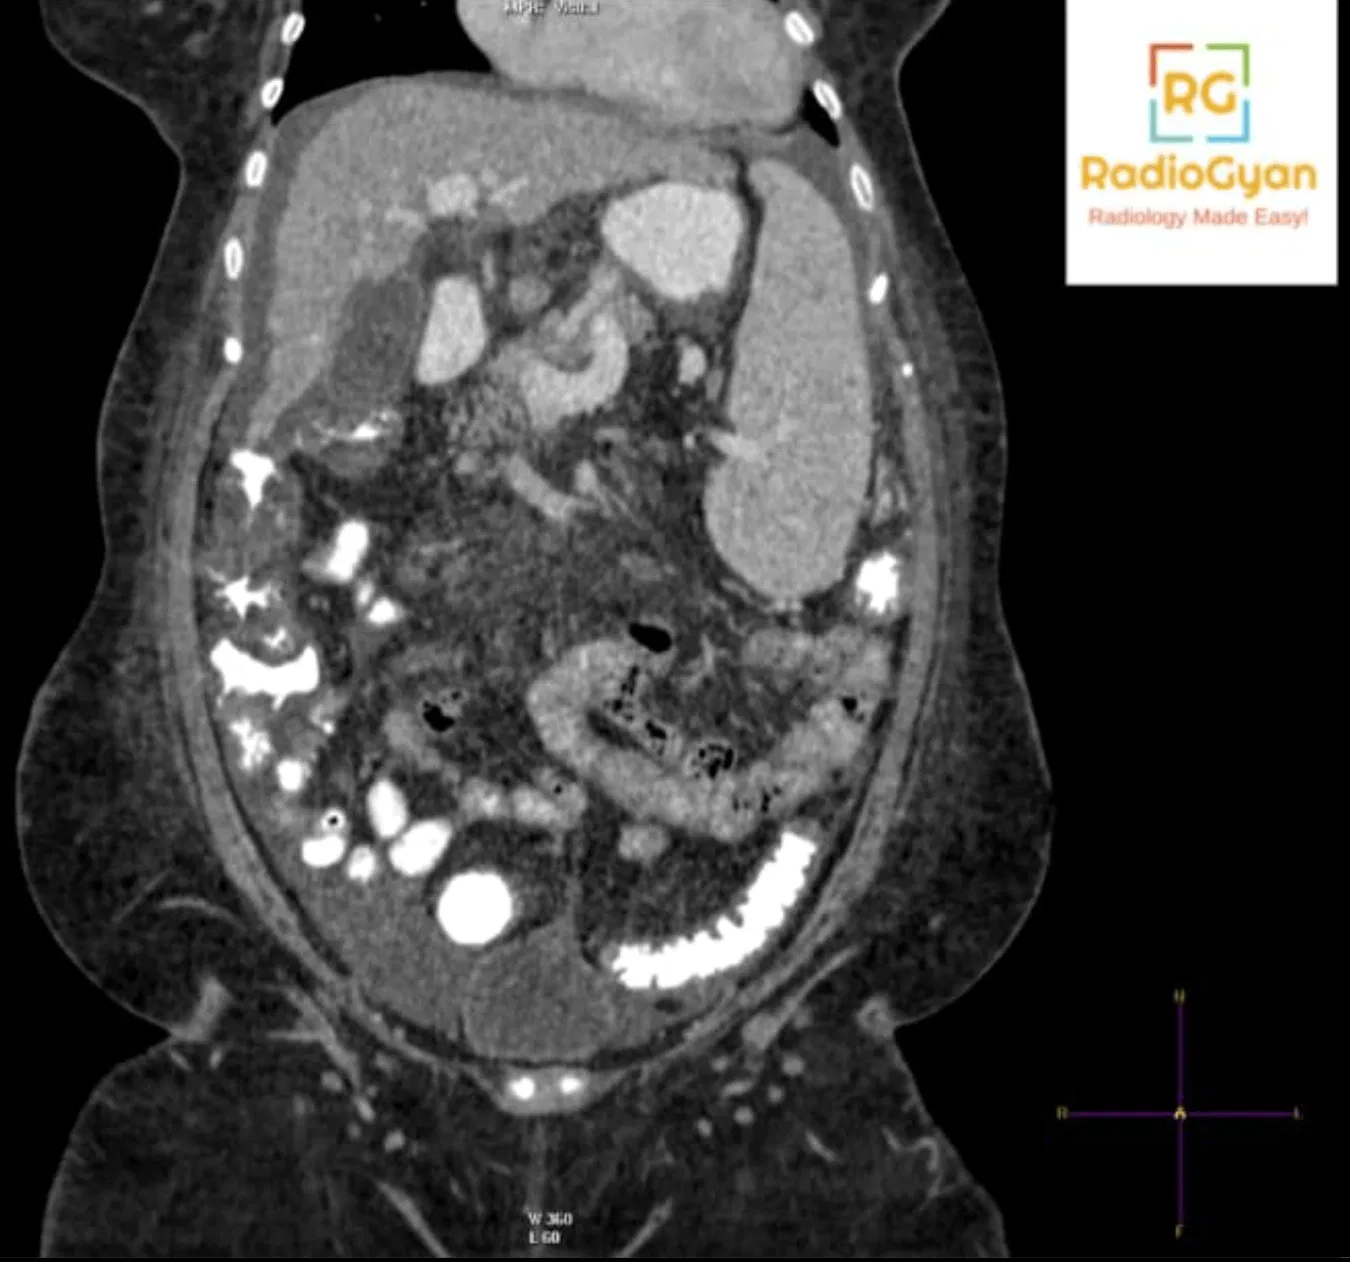
CT:
Liver-
- Surface irregularity.
- Caudate to right lobe ratio increased > 0.65.
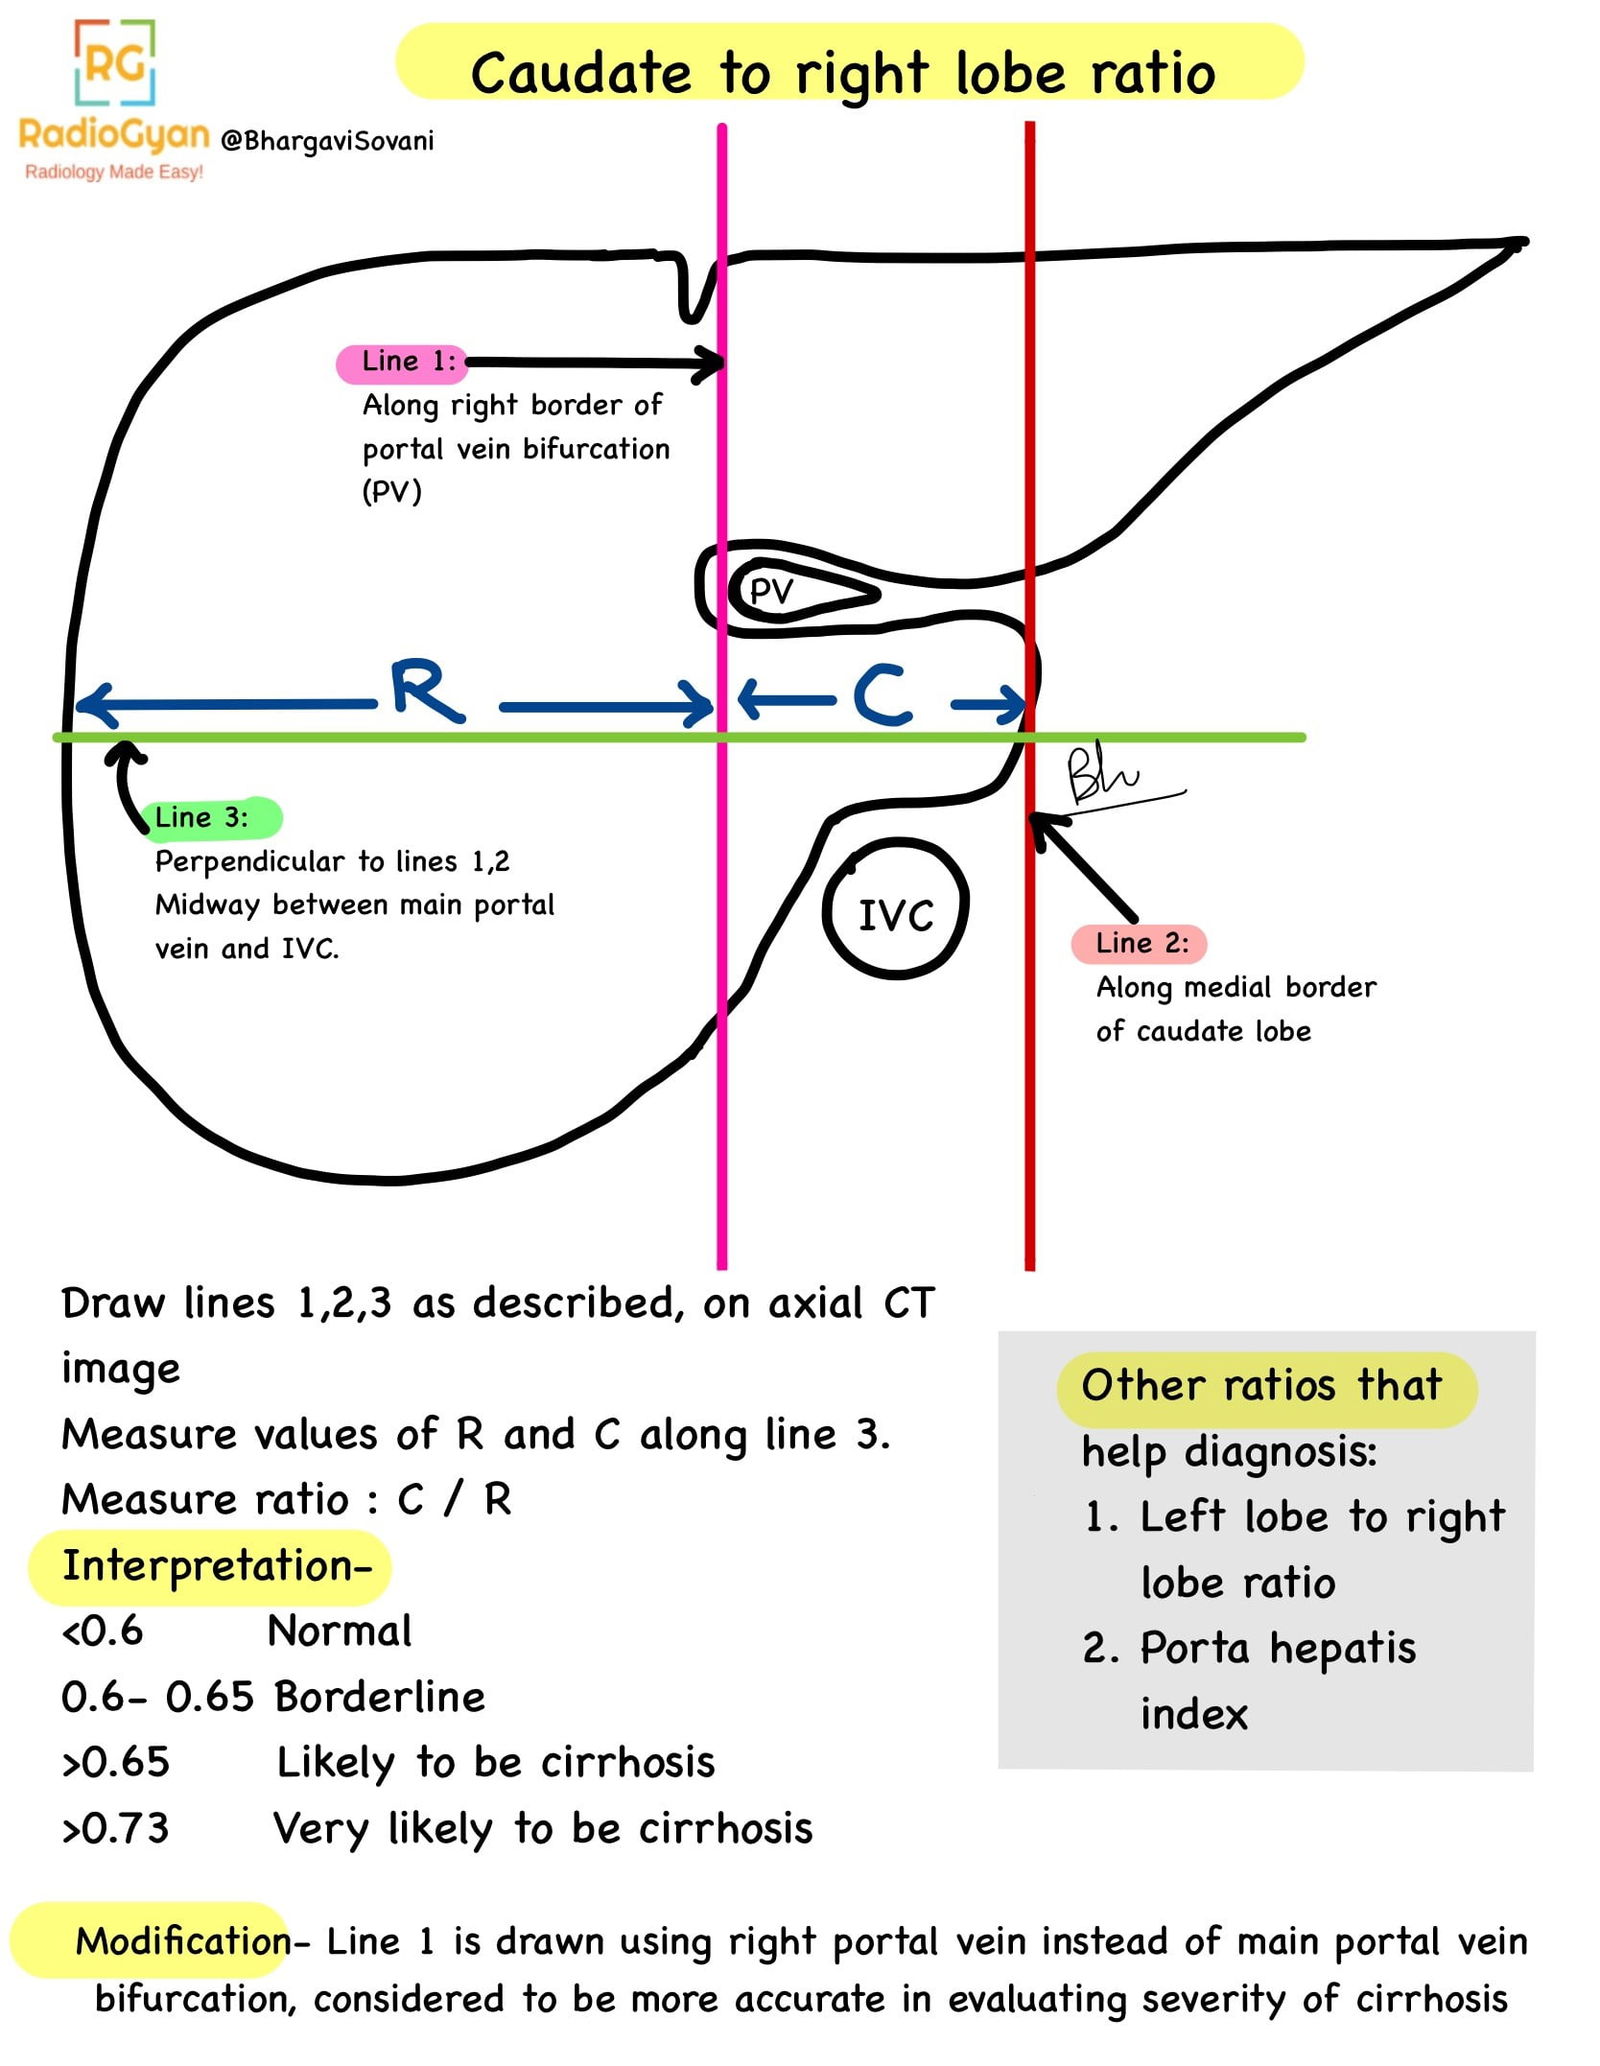
Easy to understand summary on calculation and interpretation of causate to right lobe ratio.
- Nodules –
- Regenerative: Iso or hyperattenuating;
- Siderotic: Hyperattenuating.
- Malignant : Enhance in early arterial phase (20 seconds after contrast injection), show washout of contrast on delayed phase images.
- Confluent fibrosis appears hypoattenuating on non-contrast CT and isoattenuating or slightly hypoattenuating on contrast CT images.
- Splenomegaly.
- Ascites.
- Lymphadenopathy in advanced cases.
- Enlarged portal vein, splenic vein, superior mesenteric vein.
- Collaterals delineated on contrast CT and angiography images.

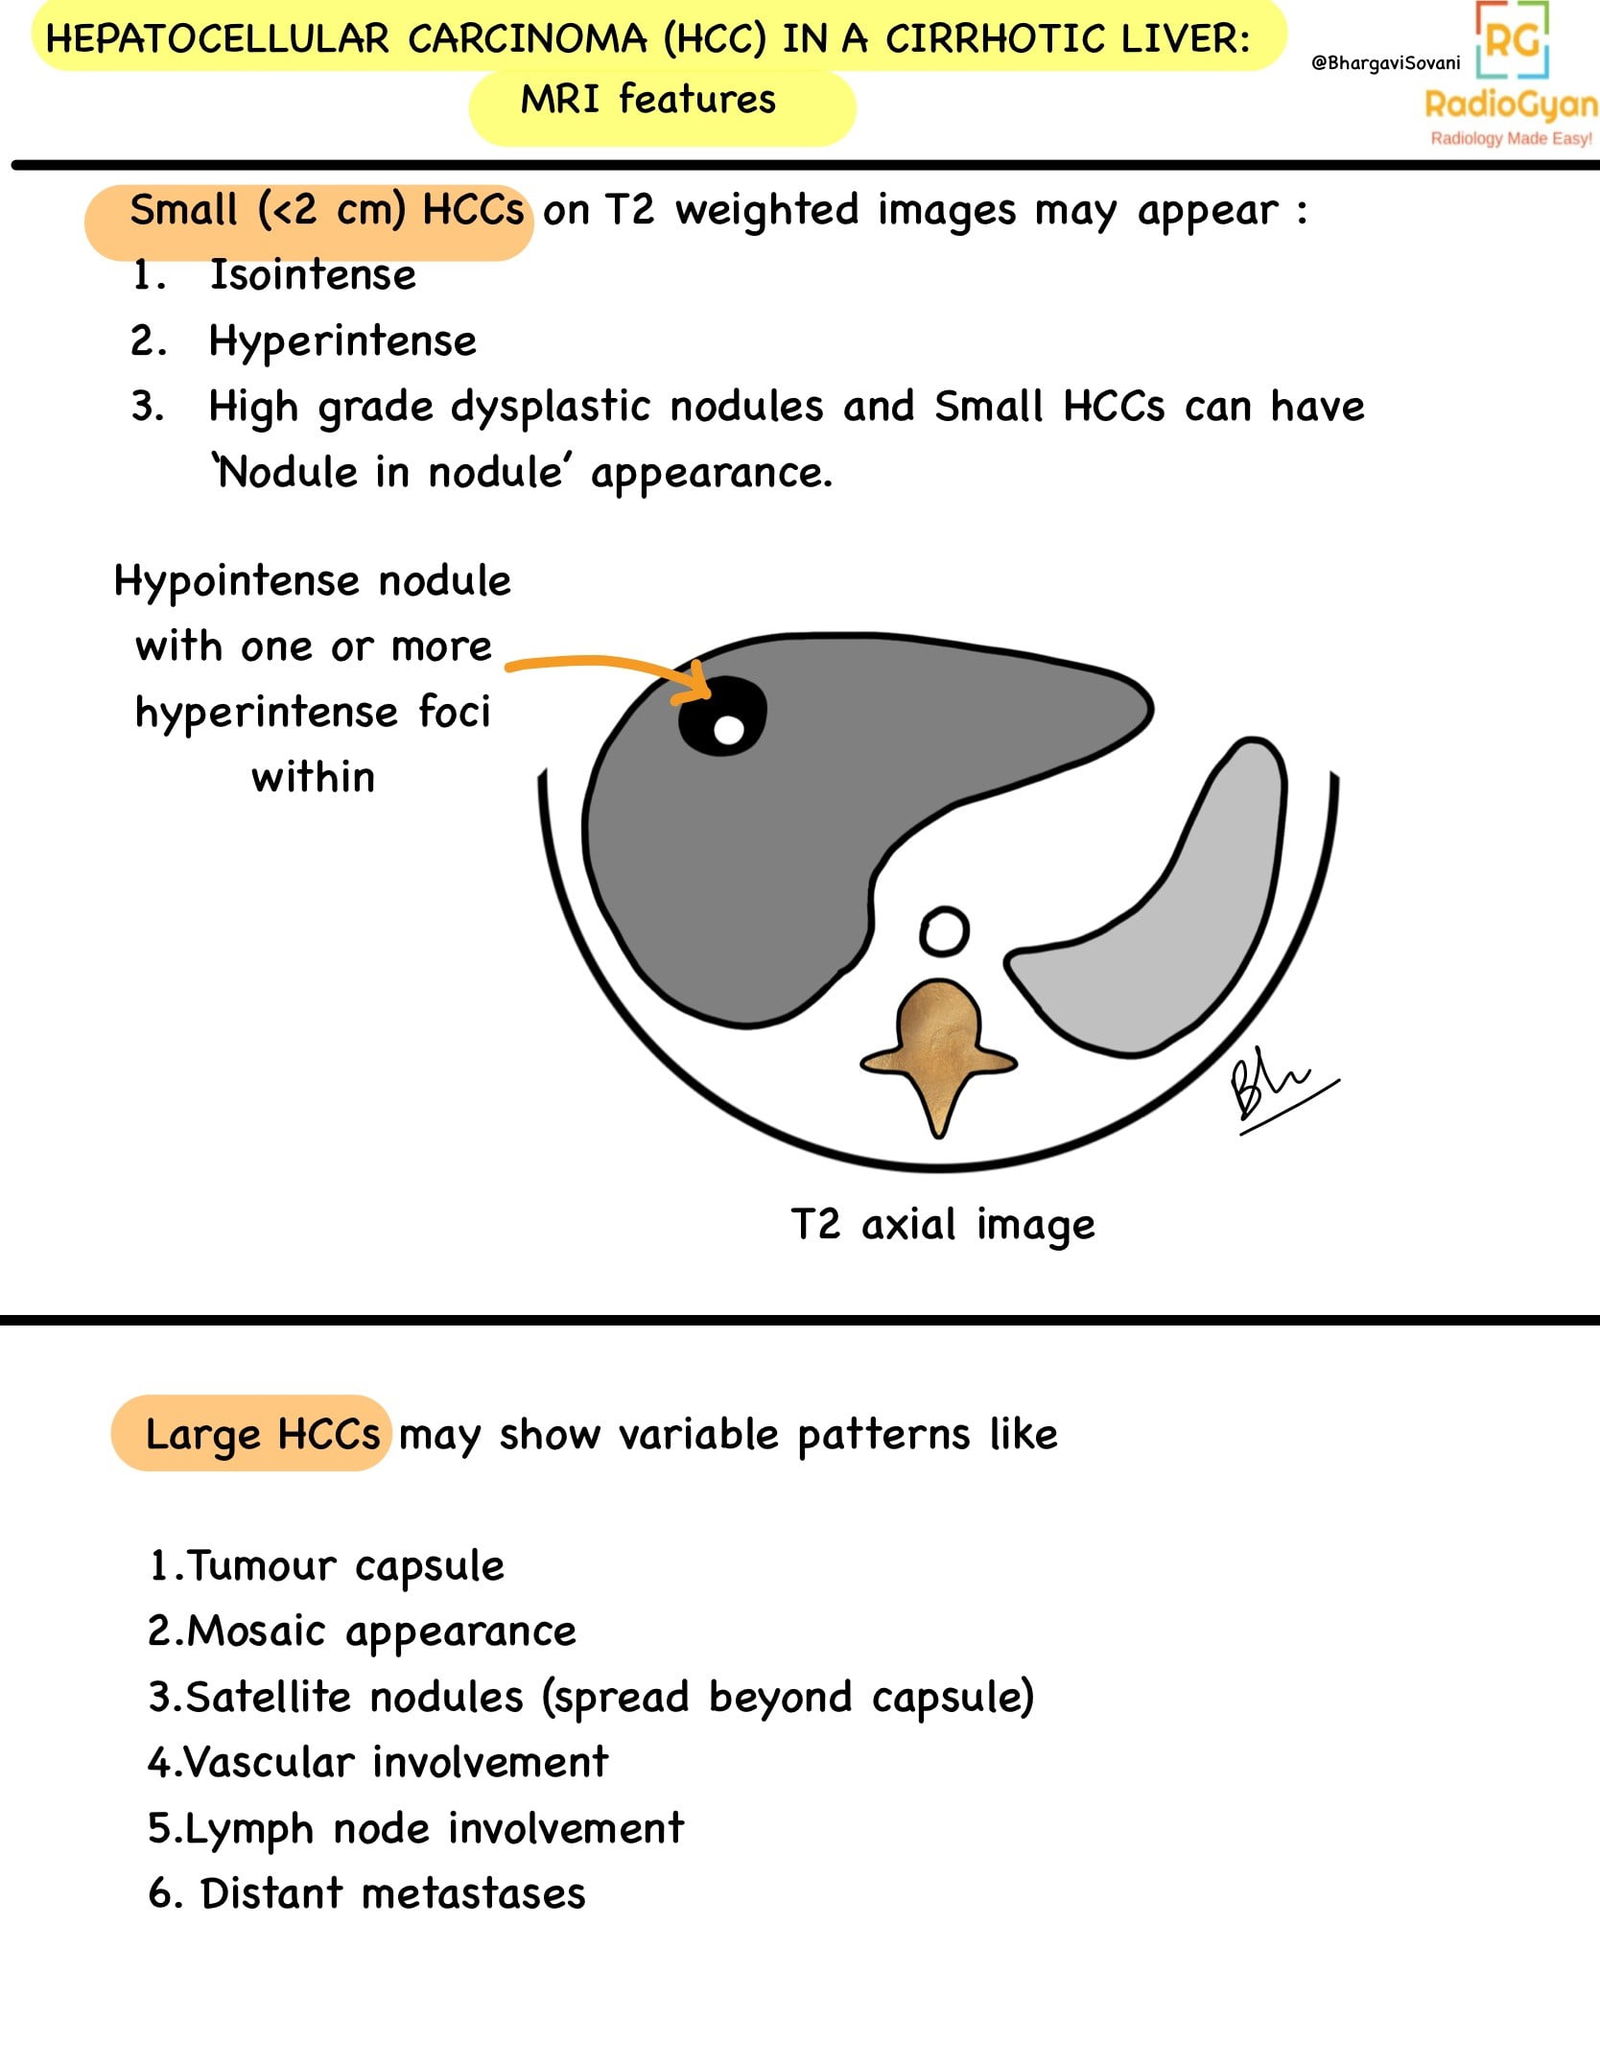
MRI-
- Morphological changes- Irregular contours, atrophy of right lobe of liver,hypertrophy of caudate lobe.
- Comma shaped intrahepatic varices seen on TOF images.
- Vascular anatomy seen with GRE images.
- Phase contrast MR Angiography sequence for direction of portal flow.
- MR Elastography : >4 kPa in fibrotic liver.
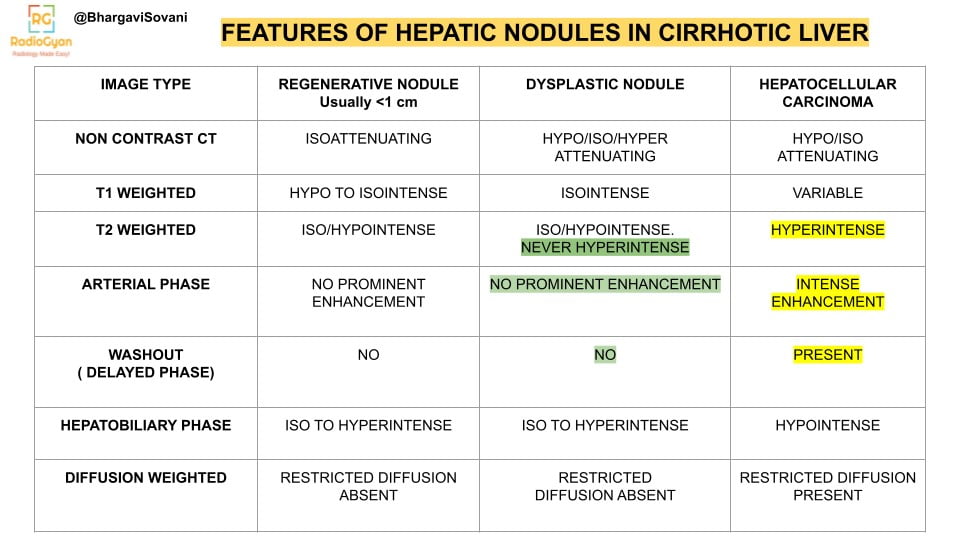
- Nodules: Regenerative, Dysplastic, Malignant nodules can be characterized. A chart summarizing the common patterns on cross sectional imaging is as follows:
Pathophysiology
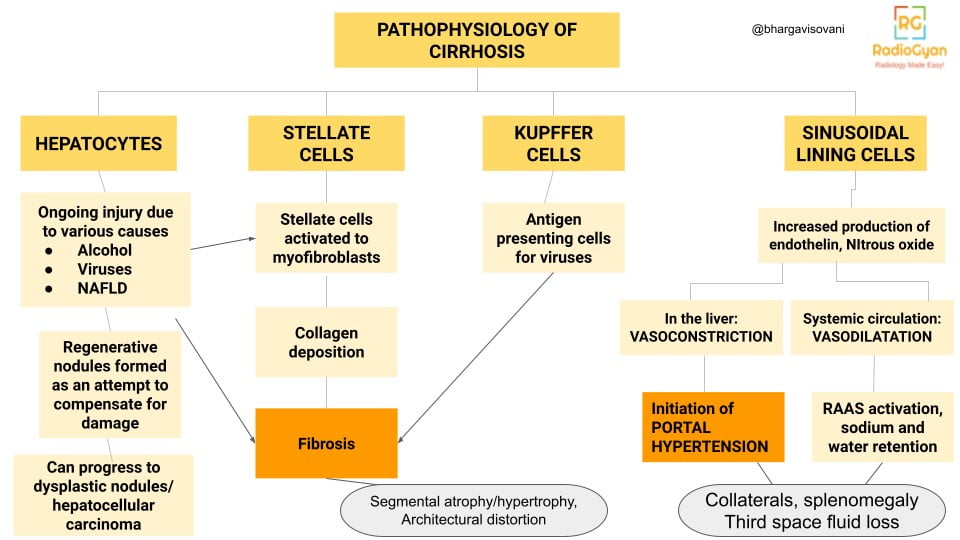
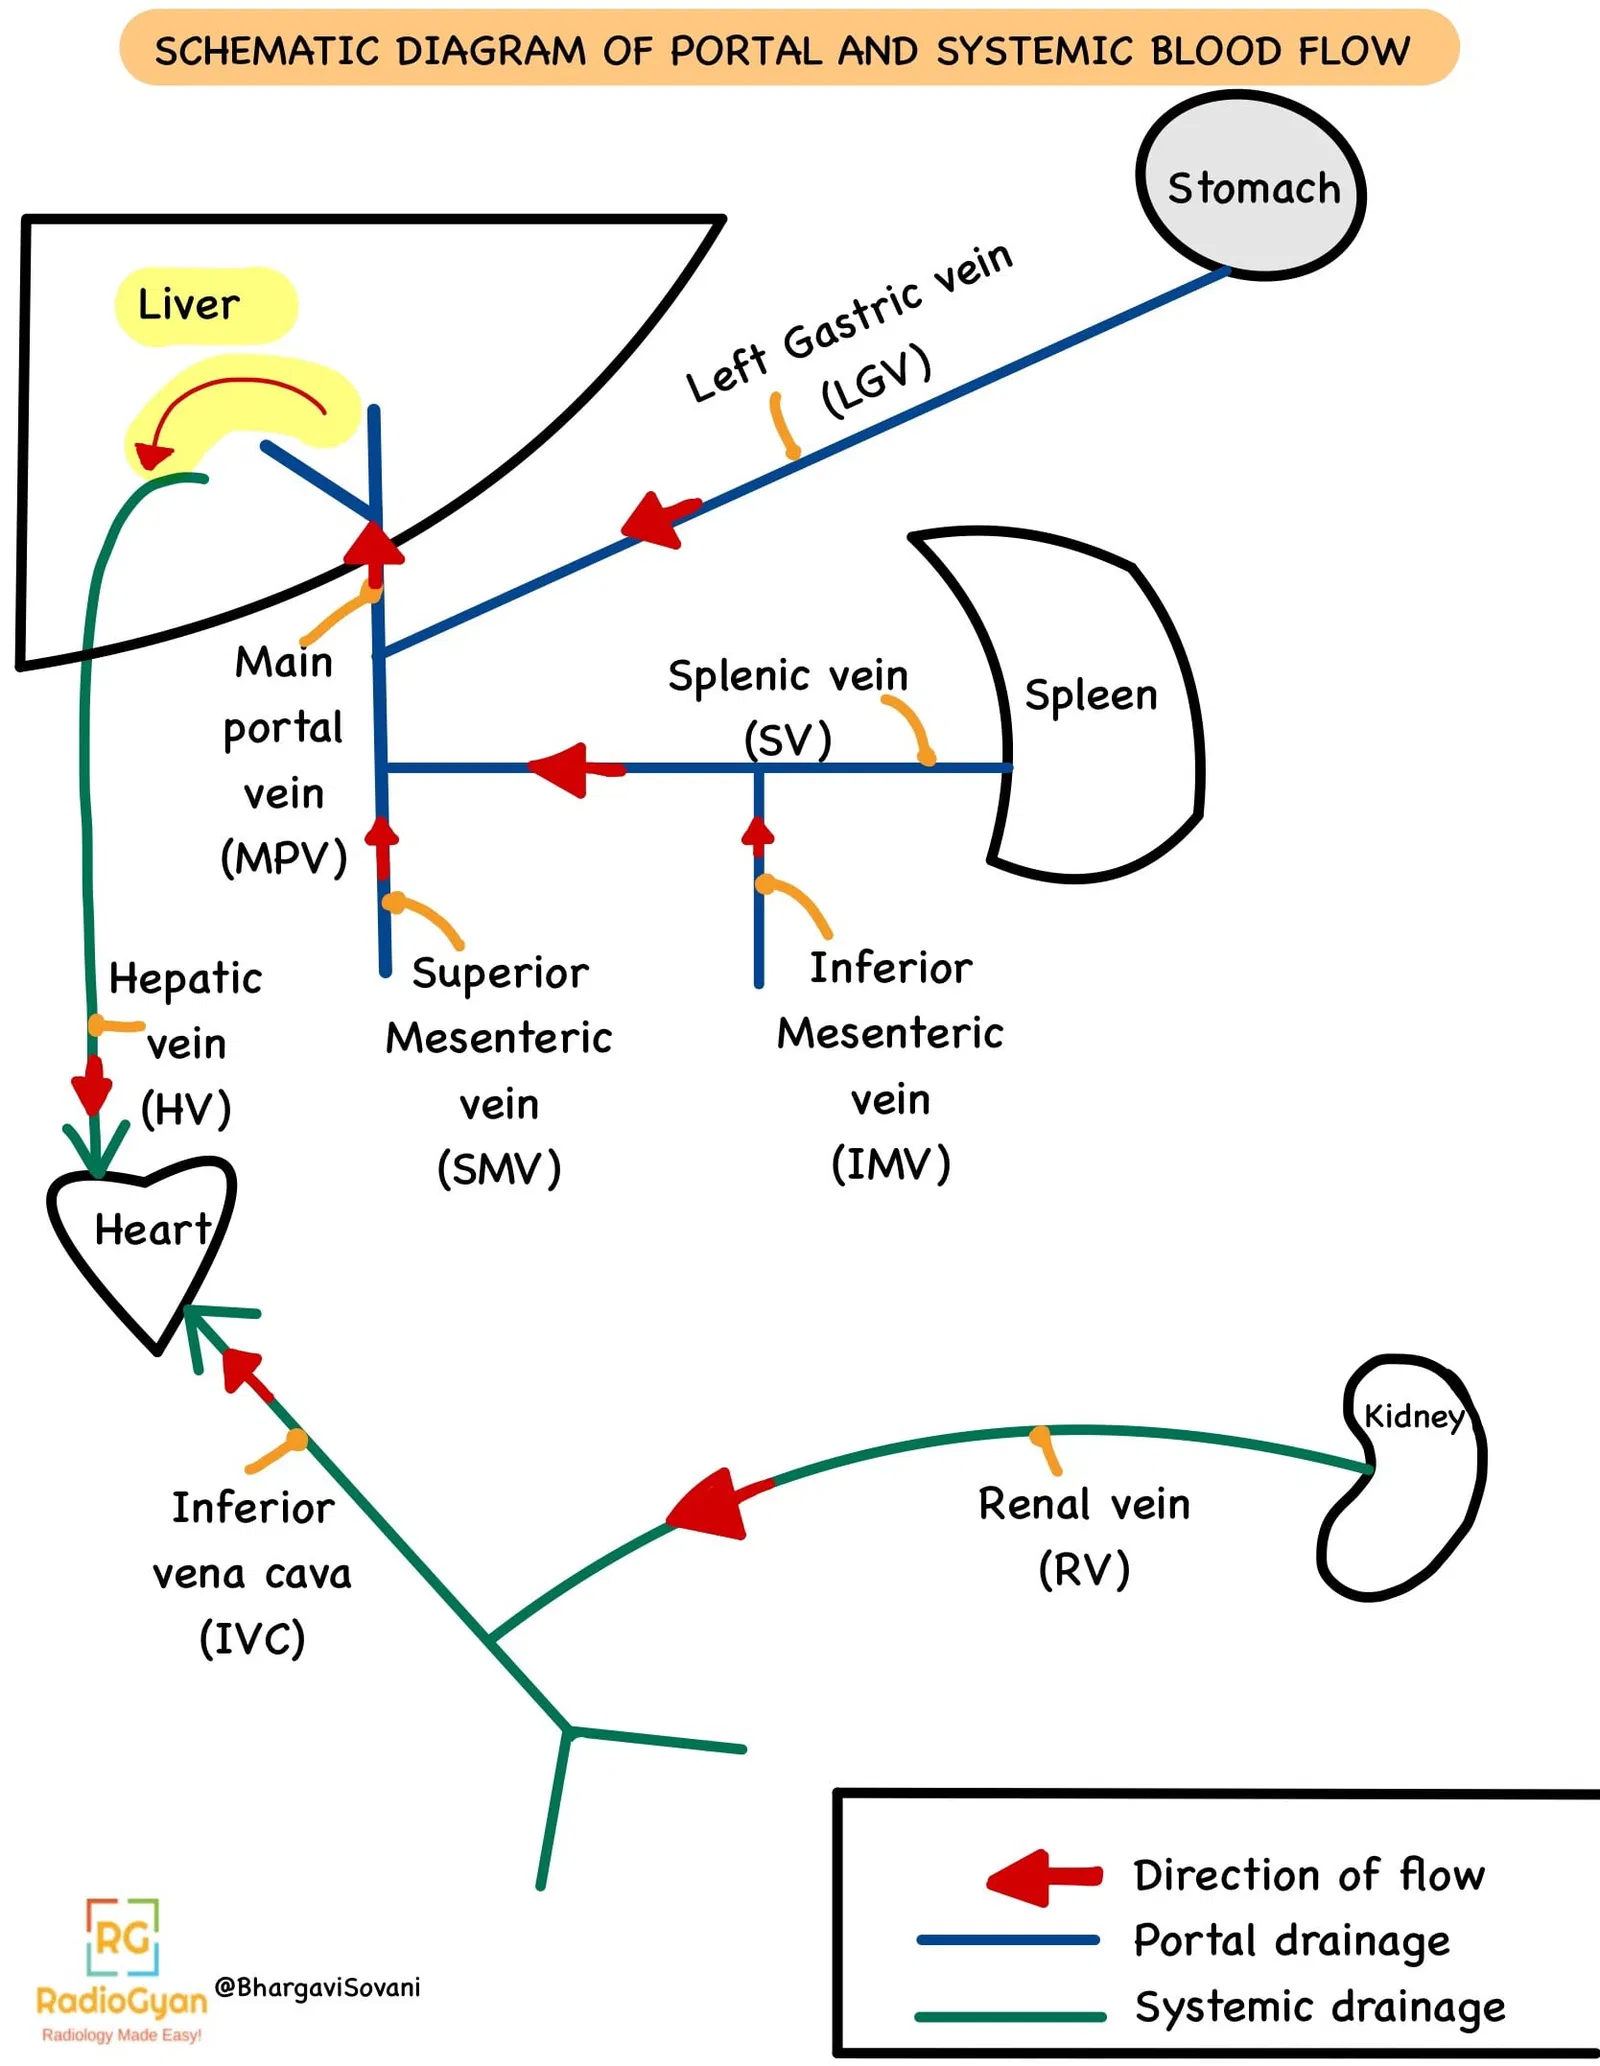
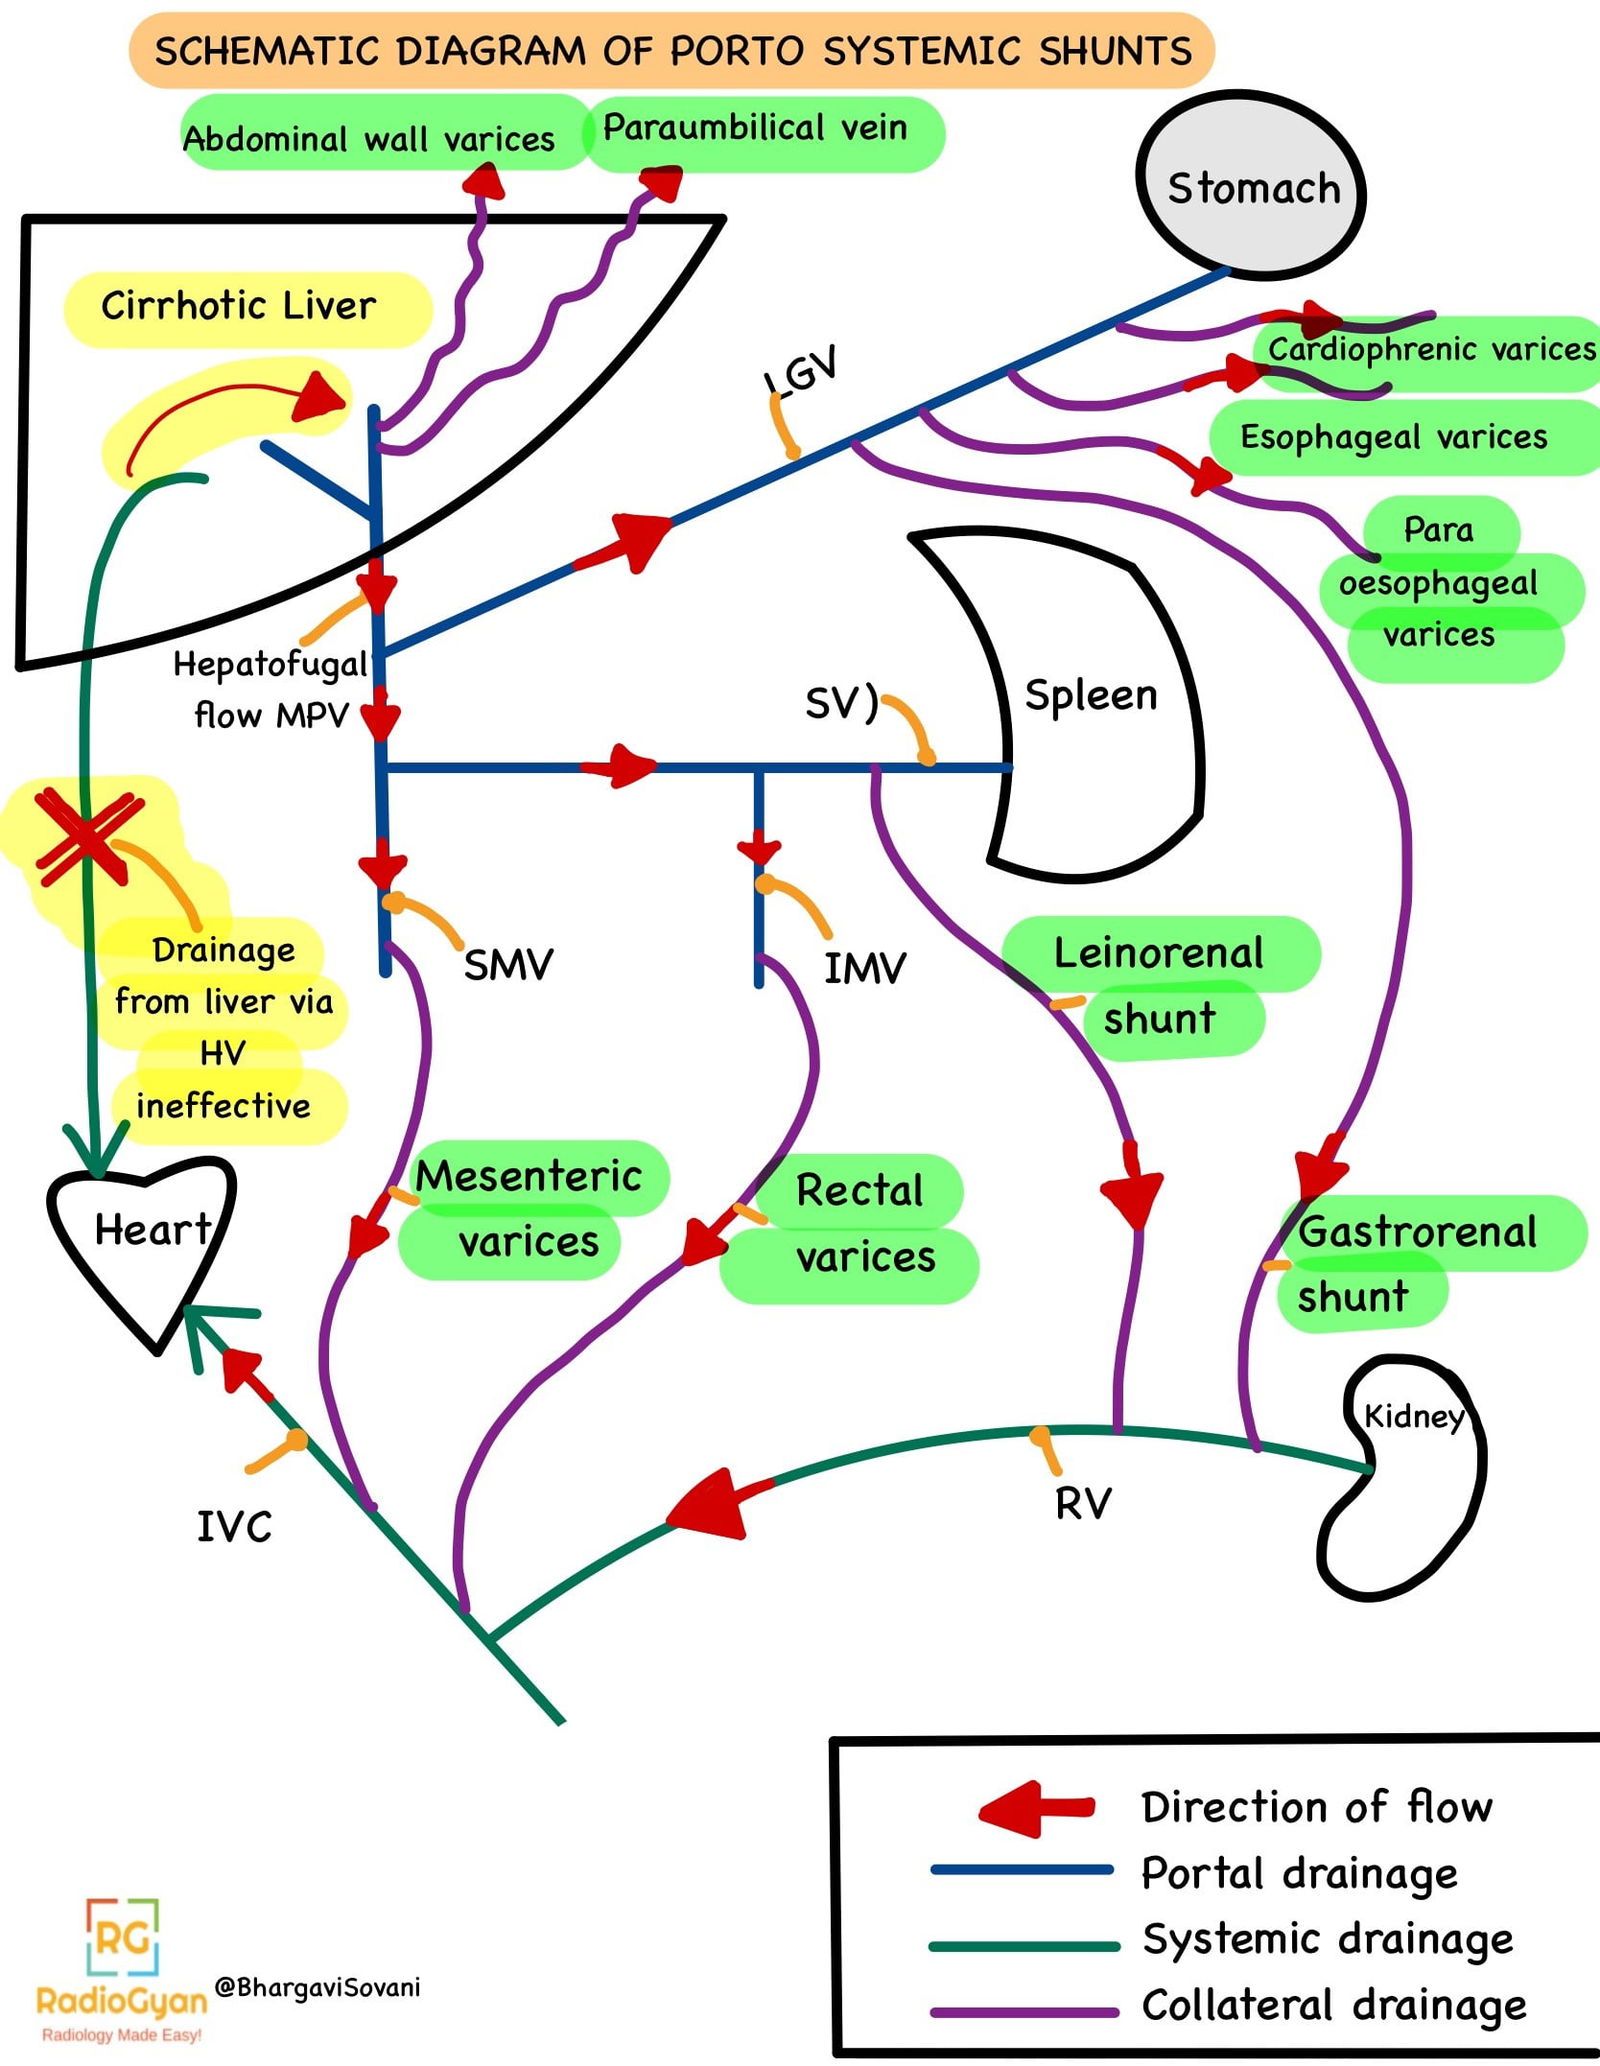
As the liver becomes too stiff due to fibrosis, it cannot effectively drain blood via the hepatic veins into the inferior vena cava. The pressure builds up in the portal vessels and flow reverses away from the liver. Collateral circulation becomes active to bypass the liver in draining blood to the heart.
The next two images show line diagrams of normal portal and systemic blood flows, and altered portosystemic shunts.
Imaging Recommendation:
Routine surveillance for malignancy, usually with 6 monthly ultrasound, or earlier as per case scenario.
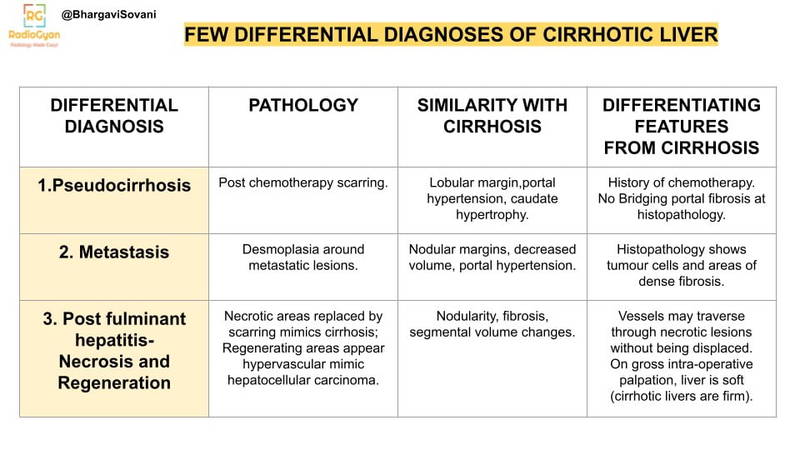
Top 3 Differential Diagnosis:
Summary on few top differential diagnosis for cirrhosis are as follows:
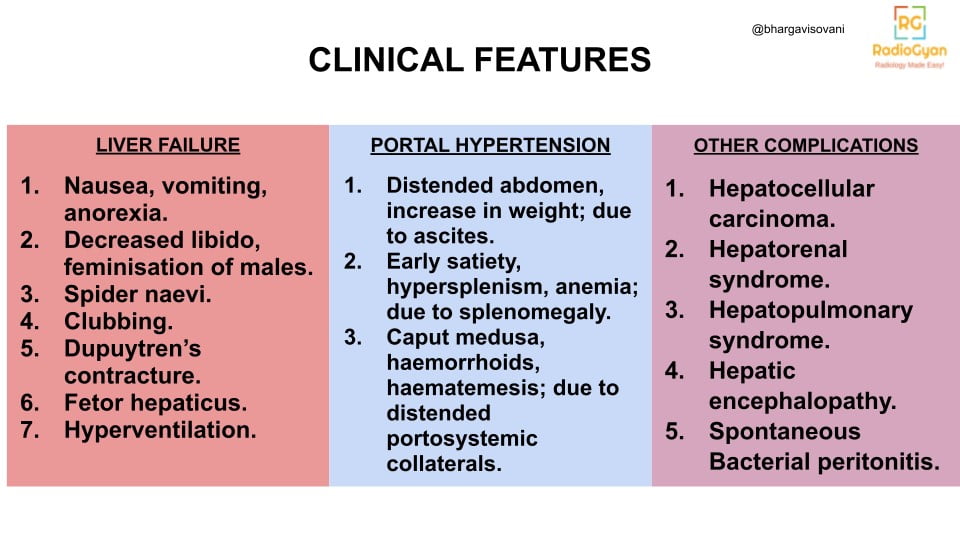
Clinical Features:
- Symptoms –
- Age/Sex predilection: Variable
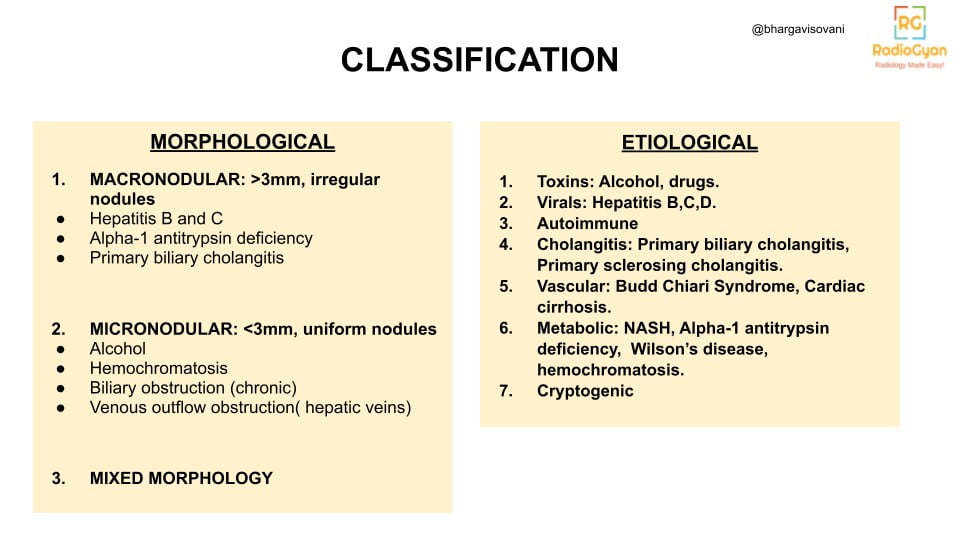
- Risk factors: Hepatitis B,C,D infections, excessive Alcohol consumption, underlying pathologies like alpha antitrypsin deficiency. Refer Etiological Classification for summarized list.
Etymology and synonyms :
The Greek word ‘kirros’ means yellowish and tawny. Adding ‘osis’ a common medical suffix to it, formed the word Cirrhosis, first described in this way by French physician Laennec.
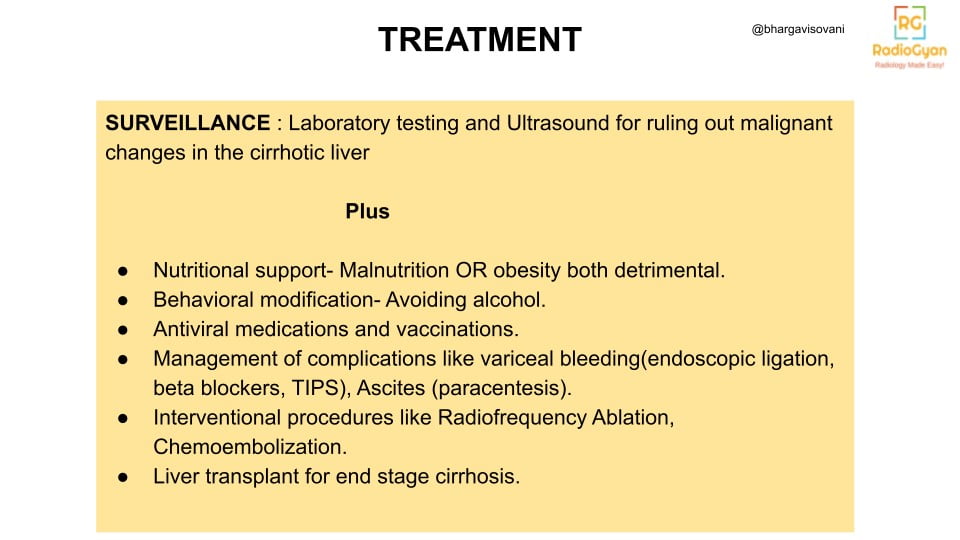
Treatment :
References:
Single best review article:
Owen, C. and Meyers, P. (2006) ‘Sonographic evaluation of the portal and Hepatic Systems’, Journal of Diagnostic Medical Sonography, 22(5), pp. 317–328. doi:10.1177/8756479306293101.
Other references:
- Maruyama, H. and Shiina, S. (2021) ‘Collaterals in portal hypertension: Anatomy and clinical relevance’, Quantitative Imaging in Medicine and Surgery, 11(8), pp. 3867–3881. doi:10.21037/qims-20-1328.
- Huber A, Ebner L, Heverhagen JT, Christe A. State-of-the-art imaging of liver fibrosis and cirrhosis: A comprehensive review of current applications and future perspectives. Eur J Radiol Open. 2015 May 26;2:90-100. doi: 10.1016/j.ejro.2015.05.002. PMID: 26937441; PMCID: PMC4750581.
- Hanna, R.F. et al. (2008) ‘Cirrhosis-associated hepatocellular nodules: Correlation of histopathologic and MR imaging features’, RadioGraphics, 28(3), pp. 747–769. doi:10.1148/rg.283055108.
- S. H. I. Desoukey, et al. “Spectrum of Acquired Portal Vein Abnormalities in Cirrhotic Liver: Dynamic MRI Findings.” ECR 2020, European Society of Radiology. Educational exhibit.
- Bandali, M.F. et al. (2017) ‘Portal hypertension: Imaging of portosystemic collateral pathways and associated image-guided therapy’, World Journal of Gastroenterology, 23(10), p. 1735. doi:10.3748/wjg.v23.i10.1735.
- Leon A Adams, Max Bulsara, Enrico Rossi, Bastiaan DeBoer, David Speers, Jacob George, James Kench, Geoffrey Farrell, Geoffrey W McCaughan, Gary P Jeffrey, Hepascore: An Accurate Validated Predictor of Liver Fibrosis in Chronic Hepatitis C Infection, Clinical Chemistry, Volume 51, Issue 10, 1 October 2005, Pages 1867–1873, https://doi.org/10.1373/clinchem.2005.048389
- Gupta, A.A. et al. (2004) ‘CT and MRI of cirrhosis and its mimics’, American Journal of Roentgenology, 183(6), pp. 1595–1601. doi:10.2214/ajr.183.6.01831595.
- Iranpour P, Lall C, Houshyar R, Helmy M, Yang A, Choi JI, Ward G, Goodwin SC. Altered Doppler flow patterns in cirrhosis patients: an overview. Ultrasonography. 2016 Jan;35(1):3-12. doi: 10.14366/usg.15020. Epub 2015 May 27. PMID: 26169079; PMCID: PMC4701371.
- Jo, P.C. et al. (2017) ‘Integration of contrast-enhanced us into a multimodality approach to imaging of nodules in a cirrhotic liver: How I do it’, Radiology, 282(2), pp. 317–331. doi:10.1148/radiol.2016151732.
- Soresi M, Giannitrapani L, Cervello M, Licata A, Montalto G. Non invasive tools for the diagnosis of liver cirrhosis. World J Gastroenterol. 2014 Dec 28;20(48):18131-50. doi: 10.3748/wjg.v20.i48.18131. PMID: 25561782; PMCID: PMC4277952.
- Moriyasu F, Nishida O, Ban N, Nakamura T, Sakai M, Miyake T, Uchino H. “Congestion index” of the portal vein. AJR Am J Roentgenol. 1986 Apr;146(4):735-9. doi: 10.2214/ajr.146.4.735. PMID: 3485345.
- Junqueira, José Claudio Nogueira et al. “Patent paraumbilical vein on ultrasound: not always cirrhosis.” (2018).
- Yoshiji H, Nagoshi S, Akahane T, Asaoka Y, Ueno Y, Ogawa K, Kawaguchi T, Kurosaki M, Sakaida I, Shimizu M, Taniai M, Terai S, Nishikawa H, Hiasa Y, Hidaka H, Miwa H, Chayama K, Enomoto N, Shimosegawa T, Takehara T, Koike K. Evidence-based clinical practice guidelines for Liver Cirrhosis 2020. J Gastroenterol. 2021 Jul;56(7):593-619. doi: 10.1007/s00535-021-01788-x. Epub 2021 Jul 7. PMID: 34231046; PMCID: PMC8280040.
- Sharma B, John S. Hepatic Cirrhosis. [Updated 2022 Oct 31]. In: StatPearls [Internet]. Treasure Island (FL): StatPearls Publishing; 2024 Jan-. Available from: https://www.ncbi.nlm.nih.gov/books/NBK482419/
Case co-authored by TeamGyan Member Dr. Bhargavi Sovani
Illustrations by Dr Bhargavi Sovani.

Improve Content And Help Your Colleagues!
Found an error in the post? Please let us know using our contact page and we will update it with due credits!
If you wish to contribute radiological images for this case (or any other article on the website), you can submit them here and you will be duly credited: Submit radiology case
very nice information
Glad you liked it.
Great educational content. Complex medical concepts are explained clearly, making it easier for readers to understand liver health issues
Thank you, Dr. Subramanian.